
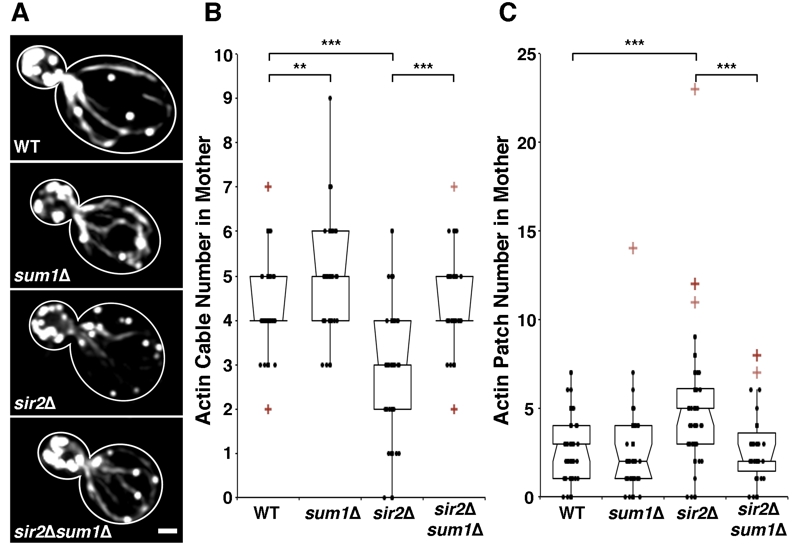
FIGURE 1: Deletion of SUM1 suppresses defects in cytoskeletal integrity of sir2∆ cells.
(A) Wild-type, sum1∆, sir2∆, and sir2∆ sum1∆ cells were stained with rhodamine-phalloidin as described in Materials and Methods. Scale bar represents 1 µm. Outlines were drawn from brightfield images.
(B) Notched dot box plot of the number of polarized actin cables greater than half the length of the mother cell. The central band in the box represents the median, boxes indicate the middle quartiles, whiskers extend to the 5th and 95th percentiles, and red points indicate outliers (defined as quartile ± 1.5x the interquartile range). n = 45 – 62 cells per strain. Data is representative of 3 independent trials. ** = P < 0.01, *** = P < 0.001. P values were calculated using Kruskal-Wallis testing.
(C) Notched dot box plot of the number of actin patches in the mother cell. Here, actin patches in the mother cell were quantified by visual inspection of cells bearing a small to medium bud (defined as cells with a ratio of bud:mother diameter of 0.2 to 0.6). During polarized growth, endocytosis and formation of actin patches occurs primarily in daughter cell. Therefore, mislocalization of patches into the mother cell early in the cell cycle is used as a marker for loss of polarity. n = 45 – 62 cells per strain. Data is representative of 3 independent trials. *** = P < 0.001. P values were calculated using Kruskal-Wallis testing.