
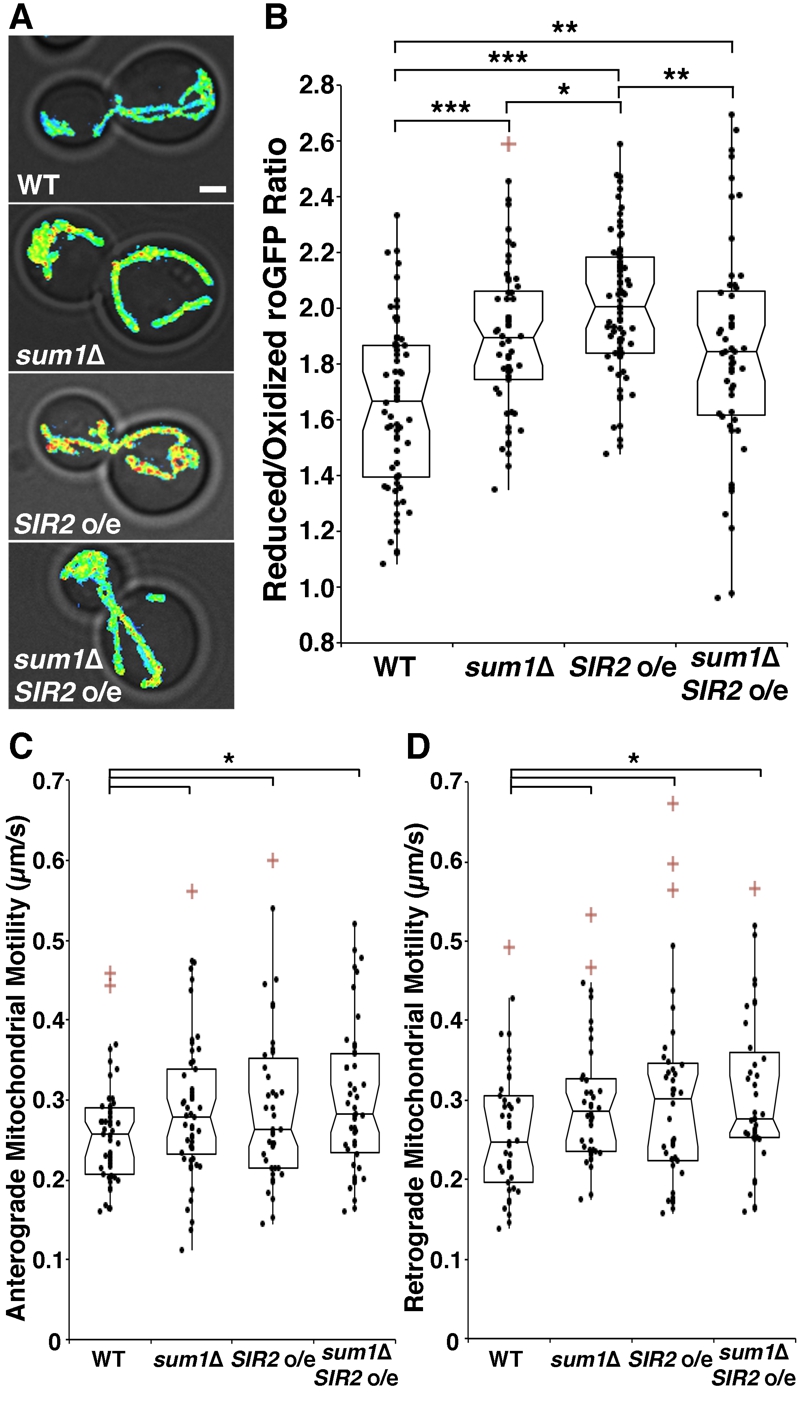
FIGURE 4: Overexpression of SIR2 and deletion of SUM1 have complementary roles in regulation of mitochondrial quality and function.
(A) Reduced:oxidized mito-roGFP1 ratios overlaid on brightfield images for wild-type, sum1∆, SIR2 o/e, and sum1∆ SIR2 o/e cells. Higher numbers and warmer colors indicate more reducing mitochondria. Scale bar, 1 µm.
(B) Notched dot box plot of the average reduced:oxidized mito-roGFP1 ratio in wild-type, sum1∆, SIR2 o/e, and sum1∆ SIR2 o/e cells. n = 53 – 66 cells per strain. Data is representative of 3 independent trials.
(C-D) Notched dot box plot of anterograde and retrograde mitochondrial movements for wild-type, sum1∆, SIR2 o/e, and sum1∆ SIR2 o/e cells. n = 43 – 54 cells per strain. Data is pooled form 3 independent trials. * = P < 0.05, ** = P < 0.01, *** = P < 0.001. P values were calculated using Kruskal-Wallis testing. Bars: 1μm. Cell outlines are shown in white.