
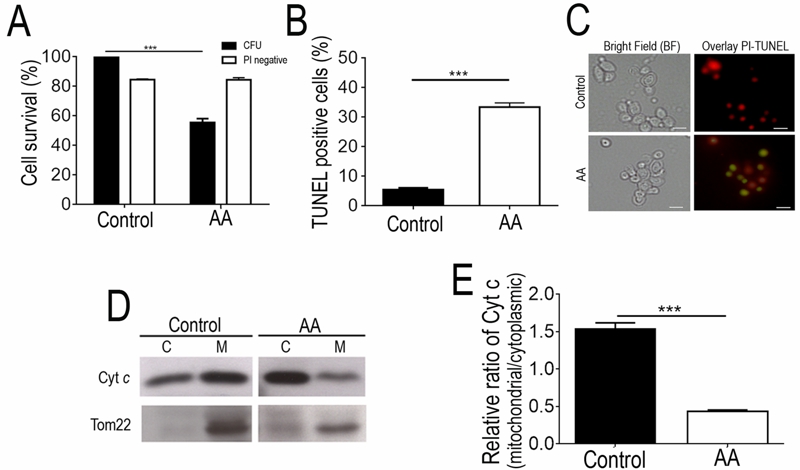
FIGURE 1: Analysis of PCD markers in strain ISA1307 acetic acid – treated cells prior to mitochondrial proteomic analysis.
(A) Comparison of the survival rate evaluated by colony-forming unit (CFU) counts and propidium iodide (PI) exclusion of strain ISA1307 cells upon acetic acid (AA) treatment with a equitoxic dose of acetic acid, during 200 min.
(B) Percentage of cells and (C) epifluorescence and bright field micrographs of untreated and acetic acid (AA)-treated strain ISA1307 cells displaying TUNEL positive phenotype. Cells were co-stained with propidium iodide in order to facilitate nuclei visualization. Bar, 5 µm.
(D) Immunoblot analysis of cytochrome c (Cyt. c) and Tom22 protein levels in 20 µg of cytoplasmic (C) and mitochondrial (M) protein extracts of 300 mM acetic acid – treated and untreated strain ISA1307 cells.
(E) Densitometric analysis of cyt. c protein levels. Analysis was performed using the ratio of cyt. c levels between the mitochondrial and the cytoplasmic protein extracts of three independent biological replicates. Bands were quantified in Quantity One® software. Significance of the data was determined by two-way ANOVA (***P < 0.001).