
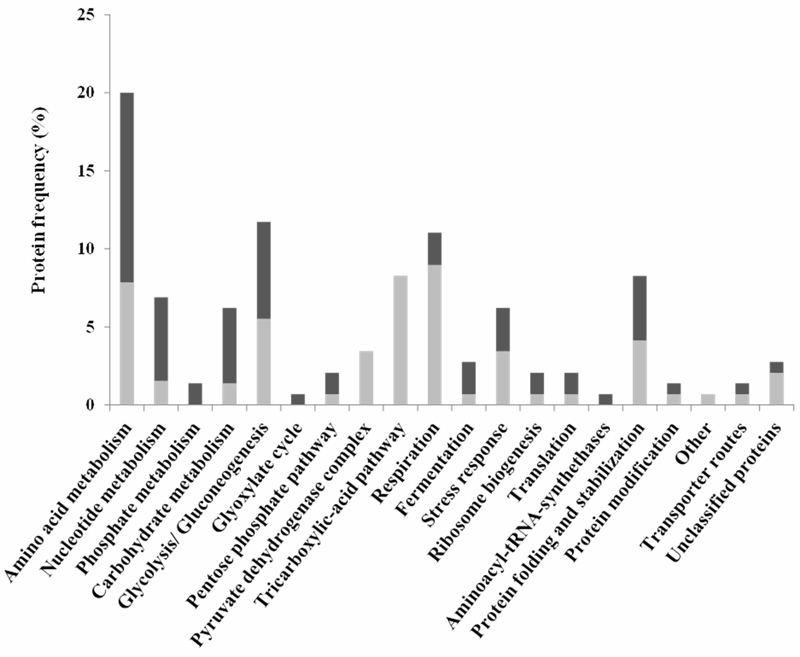
FIGURE 3: Clustering, based on physiological function, of ISA1307 proteins whose abundance changes in response to PCD – inducing concentrations of acetic acid.
The proteins whose abundance was found to change in ISA1307 cell population exposed to acetic acid – inducing PCD concentration, according to the results obtained in the quantitative proteomic analysis, were clustered using the MIPS functional catalogue. The frequency in the dataset of proteins whose abundance was increased (black bars) or decreased (light grey bars) under acetic acid – induced PCD is also indicated.