
Back to article: Breaking the bilayer: OMV formation during environmental transitions
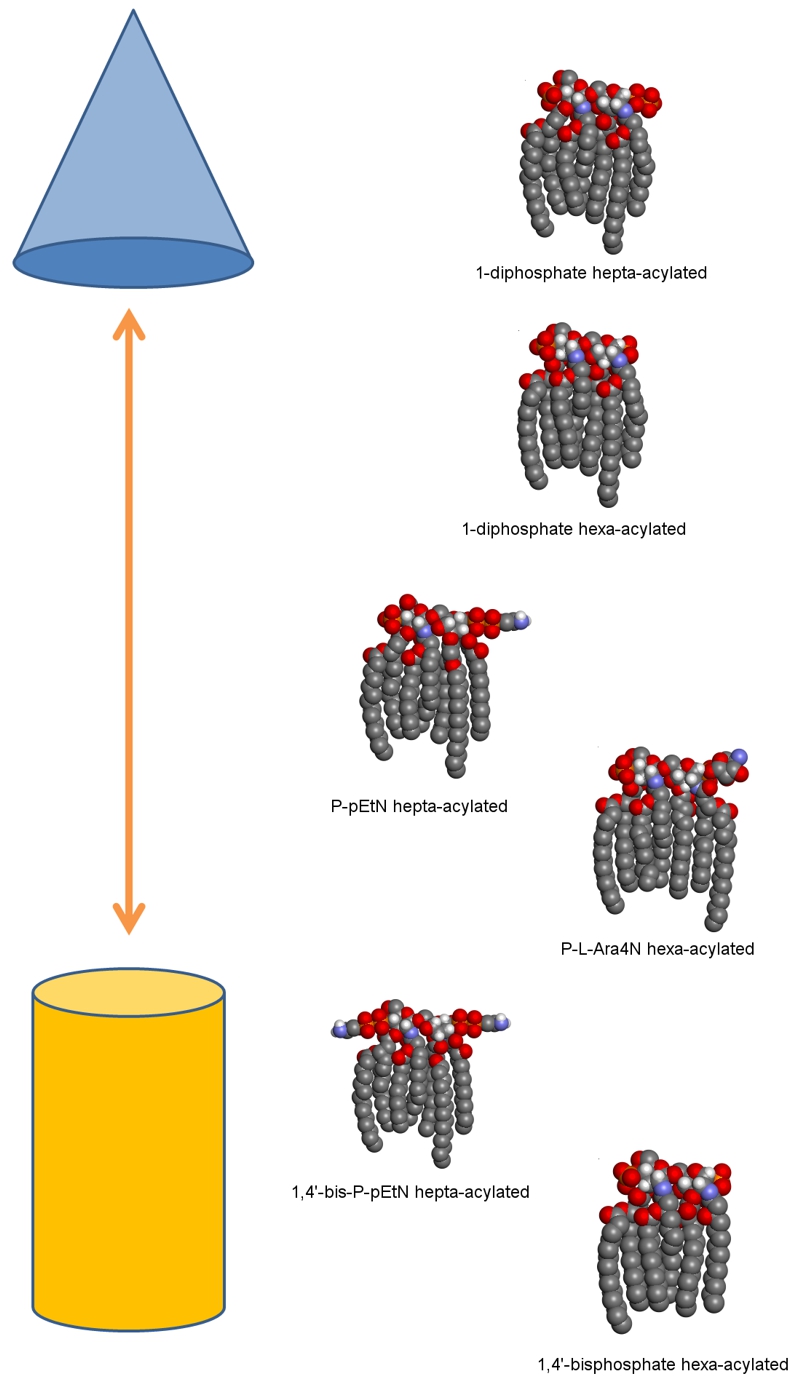
FIGURE 1: Model illustrating the diversity of lipid A structures and their preference for non-lamellar phase to lamellar phase in acidic conditions.
Lipid A molecules are shown as three-dimensional space-filling models in typical Corey-Pauling-Koltun coloring (with the majority of hydrogen atoms omitted for simplicity). The proposed relative propensity of each lipid A structure towards the hexagonal phase (top, represented by a blue cone) or towards the lamellar phase (bottom, represented by an orange cylinder) is shown here. From top to bottom these lipid A structures are shown from most to least likely to be found secreted in OMVs during 5.8L conditions according to ESI-MS data.