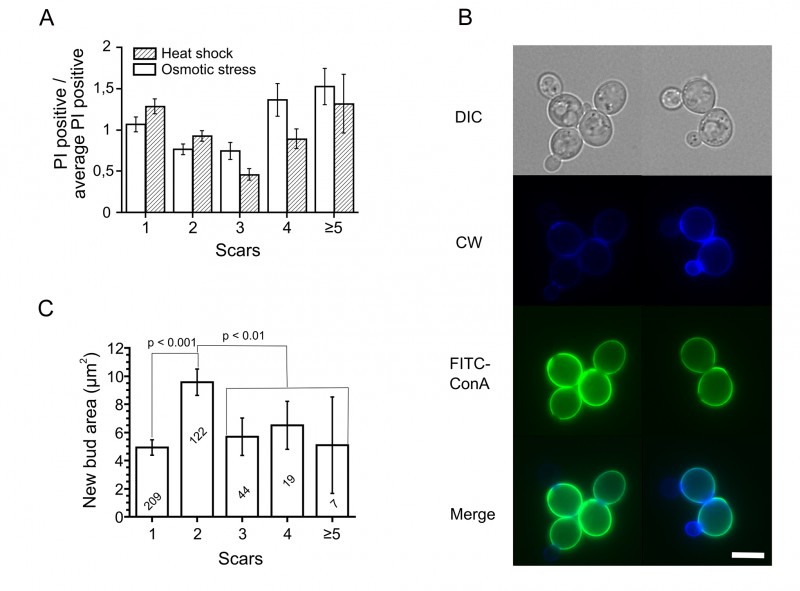
FIGURE 1: Stress resistances and regrowth of yeast cells depend on their replicative age.
(A) The data are presented as percentages of dead cells in a particular aging class divided by the average percentages of dead cells in this experiment. Values higher than one show that the percentage of dead cell in this aging class is above average, and values below one represent the relatively resistant aging classes. p < 0.01 for all treatments, Kruskal-Wallis test.
(B, C) Microscopy and quantification of regrowth. In C the exact numbers of cells analyzed are shown in each column. Bar = 5 μm.

