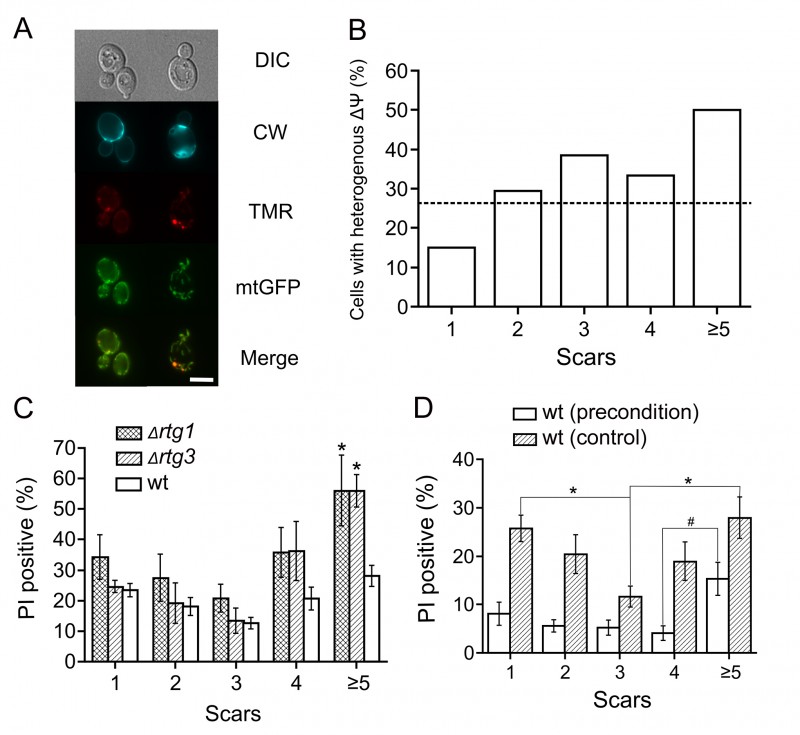
FIGURE 2:
(A) Mitochondrial heterogeneity within a cell increases with age. Representative images of cells with uniform and heterogeneous subpopulations of mitochondria. Cells expressing mitochondrial GFP (mitoGFP) were stained with tetramethylrhodamine (TMR) and calcofluor white (CW). Bar = 5 μm.
(B) Quantification of the results from (A). 114 cells were analyzed from 3 independent experiments. The difference between actual and expected (average proportion of cells with heterogeneous potential among the whole population) values is significant according to the chi-squared test (p < 0.05). Positive correlation is also significant according to Kendall’s (p-value = 0.05, tau = 0.8) and Spearman’s (p-value = 0.037, rho = 0.9) tests.
(C) Knockouts of retrograde signaling genes decrease the survival of yeast cells with replicative ages above four. Cell were subjected to heat shock and then stained with propidium iodide (PI) and calcofluor white (see Materials and methods). The scars were calculated for each individual cell. The percentage of PI-positive (dead) cells was plotted as a function of replicative age (numbers of scars). * indicates p < 0.05 when compared to wt, Wilcoxon test.
(D) Preconditioning decreases the difference in heat shock resistance between daughter cells and young mother cells. Yeast cells were incubated for 30 min at 37°C and then stressed with heat shock (47°C). Then the cells were stained with propidium iodide (PI) and calcofluor white (see Materials and methods). The percentages of PI-positive (dead) cells were plotted as a function of replicative age (numbers of scars). * indicates p < 0.01, # indicates p = 0.057.

