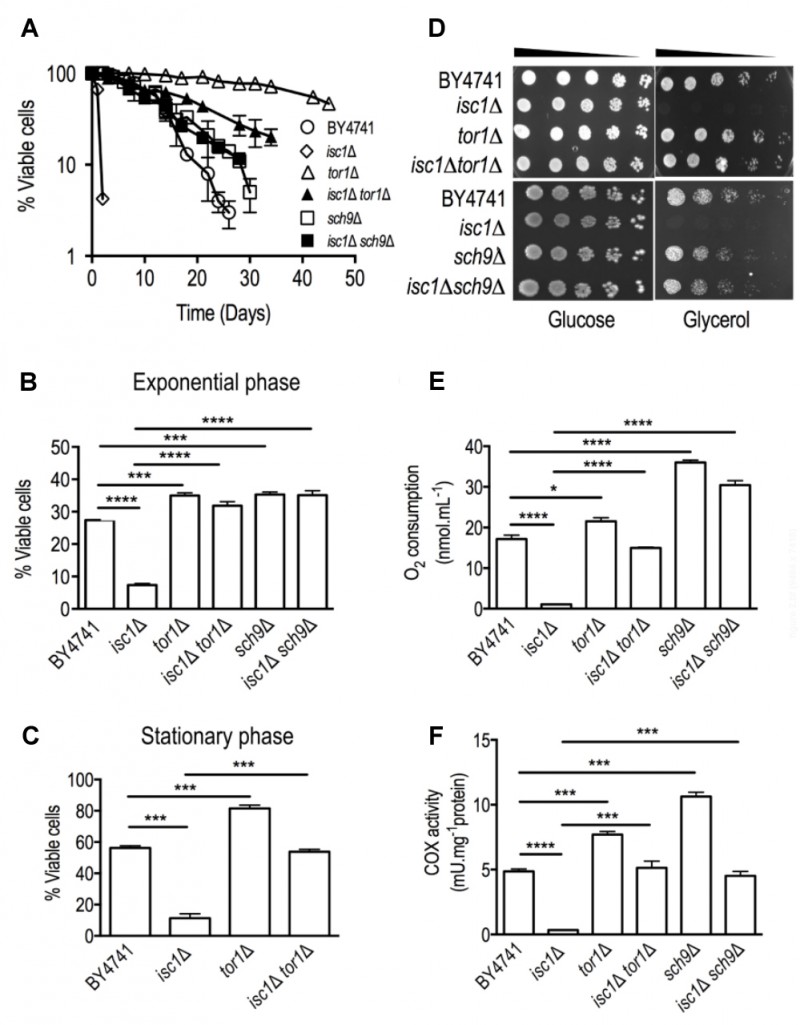
FIGURE 2: The deletion of TOR1 and SCH9 abolishes the shortened CLS, oxi-dative stress sensitivity and mitochondrial dysfunctions displayed by isc1Δ cells.
(A) S. cerevisiae BY4741, isc1Δ, tor1Δ and isc1Δtor1Δ, sch9Δ and isc1Δsch9Δ cells were grown in SC-medium and kept in the medium at 26oC. The viability was determined by standard dilution plate counts and expressed as the percentage of the colony-forming units at time T in relation to T0. Values are mean ± SD of at least three inde-pendent experiments.
(B, C) Yeast cells were grown in SC-medium to the exponential phase (B) or stationary phase (48 hours after exponential phase) (C) and exposed to 1.5 mM H2O2 for 60 min (B) or 300 mM H2O2 for 30 min (C). Cell viability was determined by standard dilution plate counts and expressed as the percentage of the colony-forming units (treated cells versus untreated cells). Values are mean ± SD of at least three independent experiments. ****p<0.0001. ***p<0.001.
(D) S. cerevisiae BY4741, isc1Δ, tor1Δ and isc1Δtor1Δ, sch9Δ and isc1Δsch9Δ cells were grown in SC-medium to the exponential phase and then diluted to OD600=0.1. Fivefold dilution series were spotted on YPD (glucose) or YPG (glycerol) medium and cells were grown at 26oC for 4 days.
(E) Oxygen consumption rate was measured in cells grown to PDS phase, as described in Materials and Methods. Values are mean ± SD of at least three independent experiments. ****p<0.0001; *p<0.05.
(F) Cytochrome c oxidase (COX) activity was determined in cells grown to the PDS phase. Cells were lysed and enzymatic activity was measured as described in Materials and Methods. Values are mean ± SD of at least three independent experiments. ****p<0.0001; ***p<0.001

