Back to article: Barcode sequencing and a high-throughput assay for chronological lifespan uncover ageing-associated genes in fission yeast
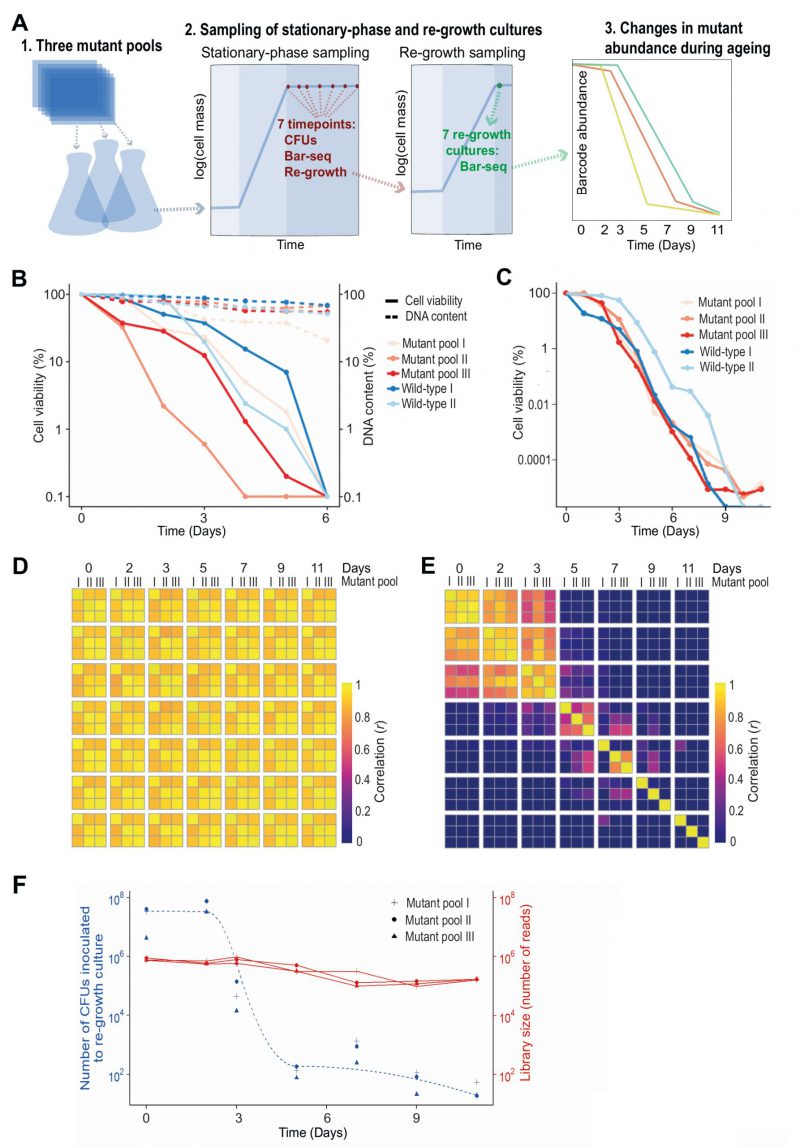
FIGURE 1: Bar-seq screen for CLS mutants.(A) Scheme of Bar-seq CLS screen design. 1. Three independent pools of all prototroph deletion mutants were generated by re-suspending nine 384-colony plates in a pre-culture of rich liquid medium. These pools were used for the three independent biological repeats of the Bar-seq screen. 2. Pre-cultured cells were grown in fresh rich medium at 32°C for ~two days until saturation (100% cell viability), followed by sampling at indicated days to (i) measure colony forming units (CFUs), (ii) determine mutant abundance in aged cultures, and (iii) inoculate fresh medium to determine mutant abundance after re-growth. 3. Selected samples were analysed by Bar-seq to identify long- and short-lived mutants from the relative changes in barcode abundance during chronological ageing. For the Bar-seq analyses, timepoint samples were collected on Days 0, 2, 3, 5, 7, 9, and 11. (B) Graph comparing cell viability (regular lines) and DNA content (dashed lines) during chronological ageing. Pools of deletion mutants (three biological repeats using independently generated deletion-mutant pools) and wild-type control cells (two biological repeats) were grown in rich medium to stationary phase (Day 0), followed by measurements of cell viability (CFU assay) and DNA content (Qubit) as indicated. The cell viability and DNA concentration (ng/µl) at Day 0 are set to 100%, with the percentages at subsequent timepoints being relative to Day 0 using a log scale. (C) Graph comparing cell viability during chronological ageing of the three independent pools of deletion mutants used for the Bar-seq screens (A) and two independent cultures of wild-type control cells. The cell viability (CFU method) is indicated as in (B). (D) Heatmap showing correlations (r) in barcode abundance across all timepoints and independent repeats of the Bar-seq screen for samples that were directly sequenced. Sample correlations between barcode counts from each pool and timepoint were calculated and plotted with the pheatmap package in R. (E) Heatmap as in (D) for samples that were re-grown before sequencing. (F) Graph showing numbers of live cells (CFUs) inoculated at each timepoint of the re-growth cultures used for the Bar-seq screens (data for three independent repeats) as well as sequence-library sizes obtained from these three independent re-growth cultures.

