Back to article: Barcode sequencing and a high-throughput assay for chronological lifespan uncover ageing-associated genes in fission yeast
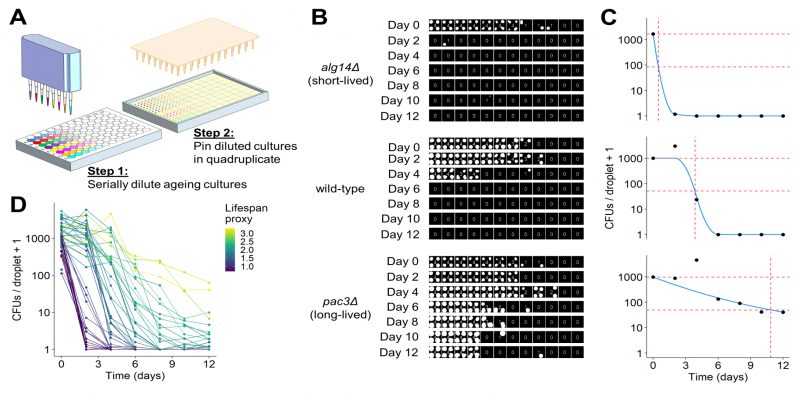
FIGURE 3: Development of robotics-based CFU assay.(A) Scheme of high-throughput CFU protocol. Aliquots of ageing cultures are loaded into the first column of a 96-well plate (8 in parallel) and serially diluted 3-fold across the plate using a liquid-handling robot or multichannel pipette. Droplets of diluted cultures are spotted onto solid agar in quadruplicate using a pinning robot (384-well format). (B) Agar plates are scanned after two to four days of growth, and images analysed using our R package, DeadOrAlive. Colony-spotting patterns for three strains (wild-type, short- and long-lived mutants predicted from Bar-seq screen) are shown for Days 0 to 12. Each position on the plate is scored for the presence or absence of colonies to quantify the colony-spotting patterns. The quantified pattern is shown at the centre of each quadruplicate, reflecting the number of colony spots observed at each dilution. Note that this method does not require the number of CFUs which give rise to each colony spot, because the colony-spotting pattern is used to determine the number of CFUs via maximum likelihood estimation (C). (C) Maximum likelihood estimates for the number of CFUs per droplet plotted against time for the three samples in B. Blue lines show constrained smoothing spline fitted to each CLS curve. Red horizontal dashed lines represent numbers of CFUs per droplet at Day 0 (100% viability) and at 5% viability. Red vertical dashed line represents time at which 5% viability is reached according to the fitted values. The square root of this number was used as lifespan proxy for each sample. (D) Maximum likelihood estimates of CFUs plotted against time for all 47 mutants validated from the Bar-seq screen, plus wild-type control. A CLS proxy was calculated for each sample (C), with each curve being coloured according to the proxy.

