Back to article: Landscapes and bacterial signatures of mucosa-associated intestinal microbiota in Chilean and Spanish patients with inflammatory bowel disease
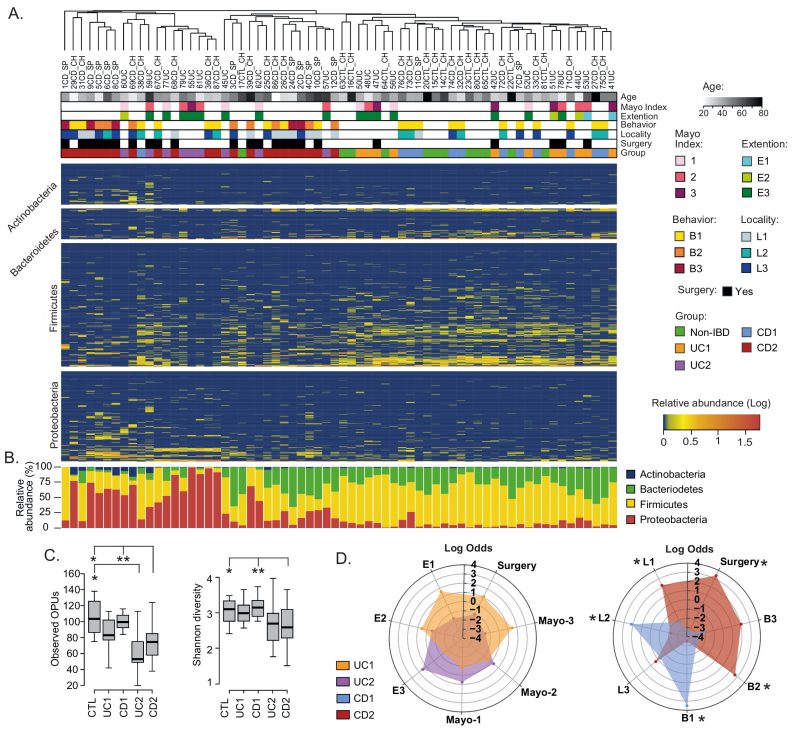
FIGURE 2: Compositional differences in the mucosa-associated intestinal microbiota among IBD patients.(A) Clustering of patients and controls and heatmap of OPU abundances. Patients (Columns) were grouped based on a hierarchical cluster analysis using relative abundances of 608 OPUs. OPUs of the four most abundant phyla are shown in the rows, and their relative abundances are shown on a log scale according to the legend. The clinical and demographic features of the patients are shown at the top and are colored according to the legend. Note that in general, patients belonging to the UC2 and CD2 groups clustered together and away from patients in the UC1 and CD1 groups and the controls (Non-IBD). (B) Relative abundances (%) per patient of the four most abundant phyla. (C) Alpha diversity between IBD groups (UC1, UC2. CD1, and CD2) and control individuals determined by the observed OPUs (Richness) and the Shannon index (Diversity). Significance: * p< 0.05, ** p< 0.005, Kruskal-Wallis & Dunn's tests. (D) Radar chart showing association of IBD groups with clinical features. Pairwise association between patient groups and clinical features was performed in contingency tables by odds ratios. Significance: * p< 0.05, Pearson's chi-squared test or Fisher's exact test. The figure was prepared using the Plotly package [52] in R [53].
52. Sievert C, Parmer C, Hocking T, Chamberlain S, Corvellec M, and Despouy P (2020). Plotly: Create Interactive Web Graphics via “plotly.js.” Available at https://cran.r-project.org/package=plotly.
53. R Core Team (2014). R: A Language and Environment for Statistical Computing. R Foundation for Statistical Computing, Vienna, Austria. Available online at https://www.R-project.org/.

