Back to article: Cleavage-defective Topoisomerase I mutants sharply increase G-quadruplex-associated genomic instability
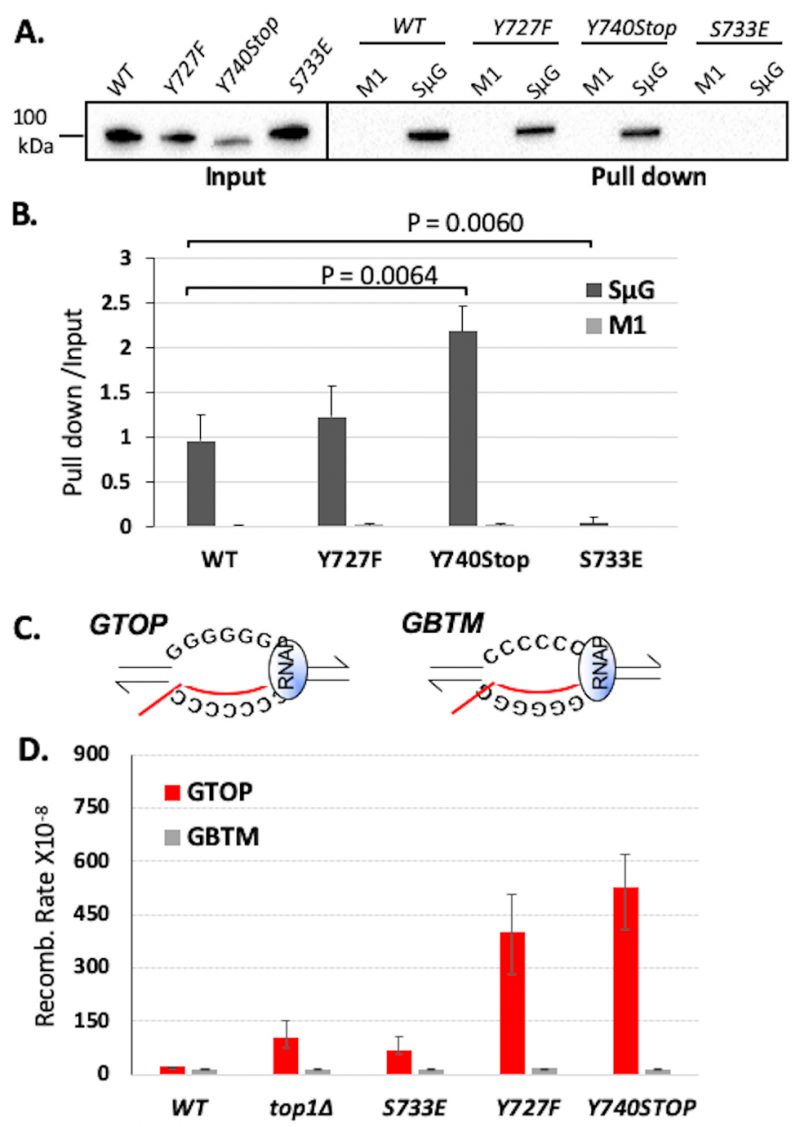
FIGURE 1: Top1 mutants bind G4 oligos in vitro and increase G4-induced recombination in yeast. (A) Western blot from biotinylated oligo pulldown assay performed with streptavidin magnetic beads and yeast whole cell lysates expressing FLAG-tagged Top1 proteins. Blot was probed with an α-FLAG-HRP (Sigma) antibody. Quantification of binding is listed below blot and was calculated by dividing input pixel intensities from pull down pixel intensities. (B) Quantification (means and standard deviations of pull-down pixel intensities normalized to input pixel intensities) of western blots from three in vitro biotin oligo pulldown assays with SµG and M1 oligos and Top1 proteins performed as in A. Vertical error bars only show positive standard deviations. P-value derived from students T-test (GraphPad Prism). (C) Transcription orientations and the guanine-runs in the Sµ-containing recombination reporter constructs. Guanine-runs are located on the non-transcribed or the transcribed strand in the pTET-lys2-GTOP or pTET-lys2-GBTM construct, respectively. The red line within the transcription bubble indicates the transcript. RNA polymerase complex is indicated as blue oval in front of the transcription bubble. (D) Recombination rates of Top1 mutant-expressing yeast strains. Rates are considered statistically significantly different if their 95% confidence intervals (shown as error bars) do not overlap [74].
74. Spell RM, Jinks-Robertson S (2004). Determination of mitotic recombination rates by fluctuation analysis in Saccharomyces cerevisiae. Methods Mol Biol 262: 3-12. 10.1385/1-59259-761-0:003

