Back to article: Cleavage-defective Topoisomerase I mutants sharply increase G-quadruplex-associated genomic instability
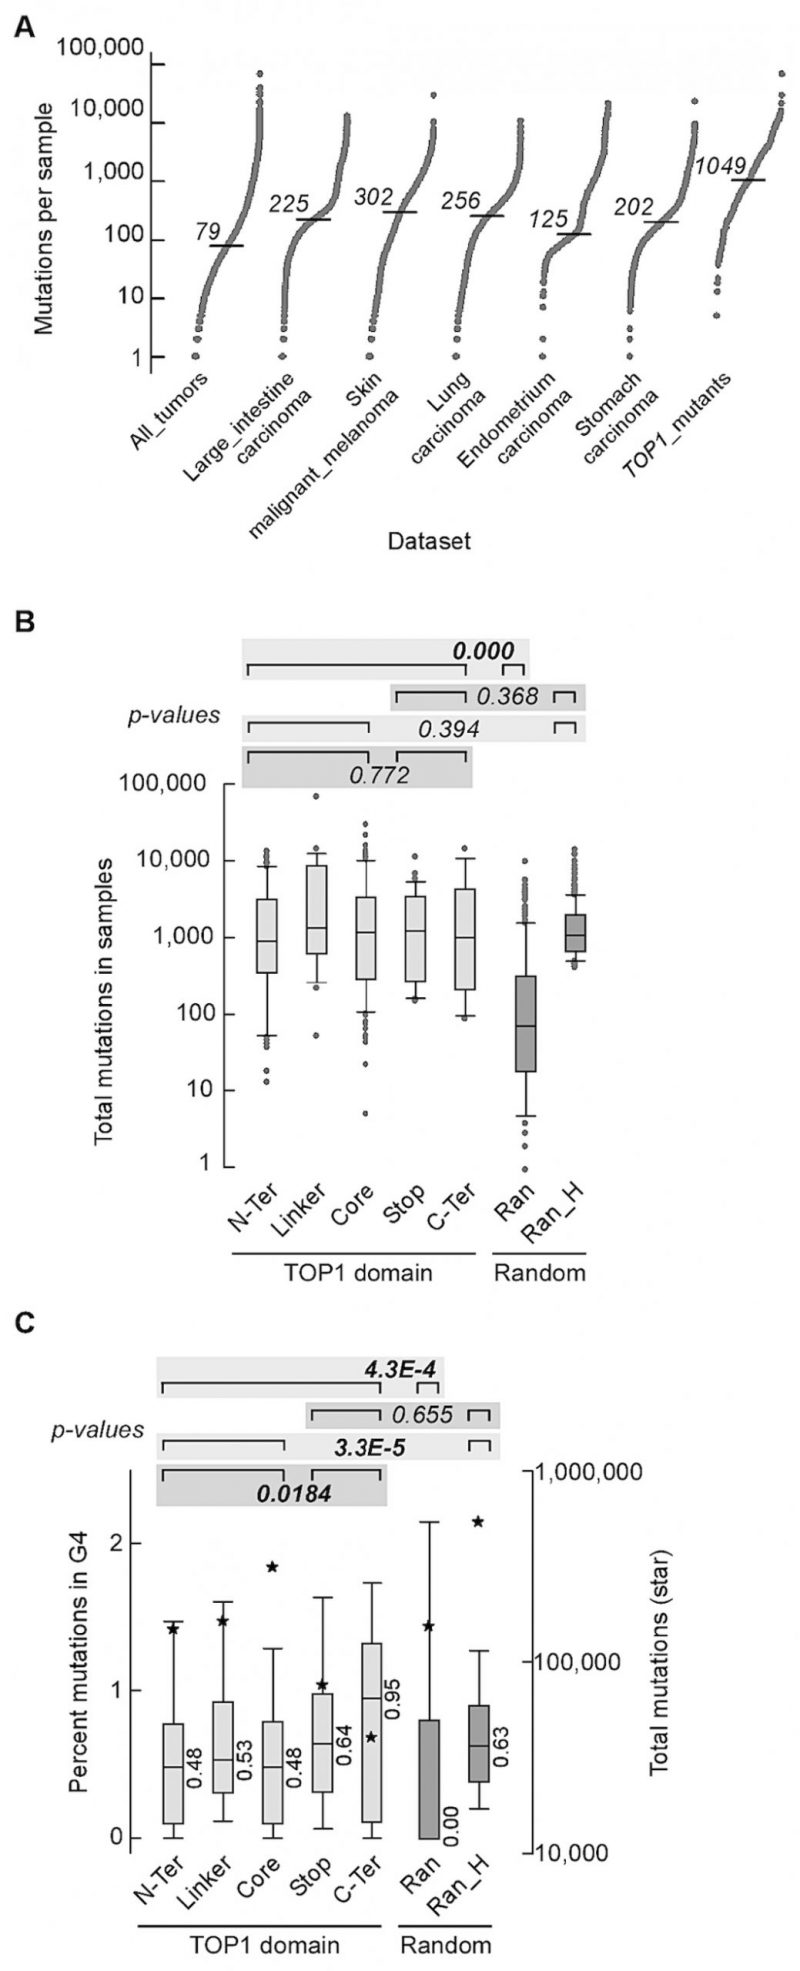
FIGURE 5: Somatic mutations in the TOP1 gene are associated with high mutation rates in cancer. (A) S-plots of number of mutations exome-wide. All_tumors, 35,887 samples from Cosmic v.94 comprising all exome-wide screens (i.e. field “Genome-wide screen” corresponding to “y”) and non-redundant sample codes; Large_intestine carcinoma, 2,355 samples from All_tumors comprising carcinomas of the large intestine, 44 of which had mutations in TOP1; skin_malignant_melanoma, 1,372 samples from All_tumors with malignant melanoma of the skin, 31 with mutations in TOP1; Lung_carcinoma, 2,512 lung carcinoma samples from All_tumors, 27 with TOP1 mutations; Endometrium_carcinoma, 606 samples from All_tumors with carcinoma in the lining of the womb, 23 with mutations in TOP1; Stomach_carcinoma, 1,349 samples from All_tumors with stomach carcinoma, 16 with TOP1 mutations; TOP1_mutants, all 239 samples from All_tumors with mutations in TOP1. Horizontal dash, median. (B) Box plot shows number of mutations in samples carrying mutations in different TOP1 domains. N-Ter, 61 samples with mutations in the amino terminus domain (median = 878); Linker, 26 samples with mutations in the Linker (median = 1321.5); Core, 102 samples with mutations in the Core domain (median = 1,149); Stop, 36 samples with nonsense mutations (median = 1,219); C-Ter, 14 samples with mutations in the carboxyl terminus domain (median = 982.5); Ran, 300 samples chosen at random among All_tumors (median = 73.5); Ran_H, random_high: a pool of 1,500 random samples with at least 400 mutations each were chosen from All_tumors and 300 entries were then chosen from the pool, after removing samples with identical codes but assigned to different types of tumor in COSMIC (median = 1049). P-values were from Wilcoxon tests. For the purpose of single Wilcoxon tests, we combined the numbers of mutations and numbers of samples when applicable. All p-values are shown in Table S14. (C) Box plots of mutations at G4 tracts. For each sample the value refers to the percent mutations that overlapped with G4-forming repeats. Data sets are as in panel B. Stars, total number of mutations; median values are shown. P-values from Wilcoxon tests. For the purpose of single Wilcoxon tests, we combined the percent mutations at G4 and numbers of samples when applicable. All p-values are shown in Table S15. Outliers were removed for clarity.

