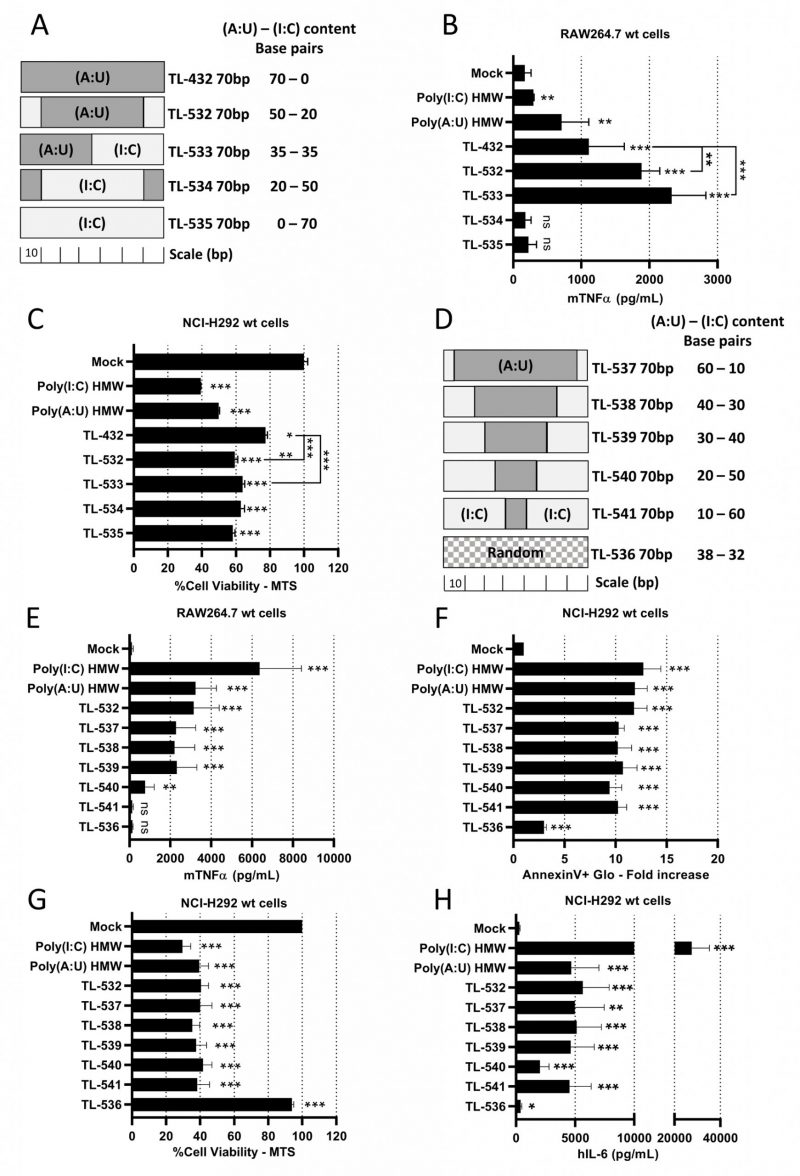
FIGURE 2: TL-532 induces the best biological balance between inflammation in RAW264.7 wt cells and tumor inflammatory cell death in NCI-H292 wt cells. (A, D) Schematic representation of the 70 bp dsRNAs showing their differing (A:U) and (I:C) bp content. (B, E) Activation of myeloid cells by TLR3-ligands was determined on RAW264.7 cells treated with the different molecules at 10 µg/mL for 24 hours. The concentration of mTNFα was measured by ELISA. (C, F, G, H) Activation of tumor cells by TLR3-ligands was determined on NCI-H292 cells treated with the different molecules at 500 µg/ml (C), 100 µg/ml (F, G), or 10 µg/ml (H) for 24 hours. Cell viability was measured with MTS assay and expressed as percentage of untreated cells (C, G). Apoptosis was measured with AnnexinV-Glo assay and expressed as fold increase of untreated cells (F). The concentration of hIL-6 was measured by ELISA (H). (B, C) Among the tested molecules, TL-532 and TL-533 induce the highest biological responses in both RAW264.7 wt and NCI-H292 wt cells. (E) Increasing (I:C) bp content reduces RAW264.7 wt cells activation. TL-536 is inactive in RAW264.7 wt, unlike TL-532. (F-H) Increasing (I:C) bp content does not impact the induction of apoptosis, viability reduction, and hIL-6 secretion in NCI-H292 wt cells except for TL-540, which induces less hIL-6 secretion comparatively. TL-536 is barely active in NCI-H292 wt cells, contrary to the TL-532. Data are the representative (C) or are the mean of three independent experiments (B, E-H). Results are expressed as mean ± SD. Unpaired Student's t-test: * = p<0.05; ** = p<0.01; *** = p<0.001; ns: not significant. Unpaired Student's t-test values are compared to Mock condition unless otherwise stated.
By continuing to use the site, you agree to the use of cookies. more information
The cookie settings on this website are set to "allow cookies" to give you the best browsing experience possible. If you continue to use this website without changing your cookie settings or you click "Accept" below then you are consenting to this. Please refer to our "privacy statement" and our "terms of use" for further information.

