
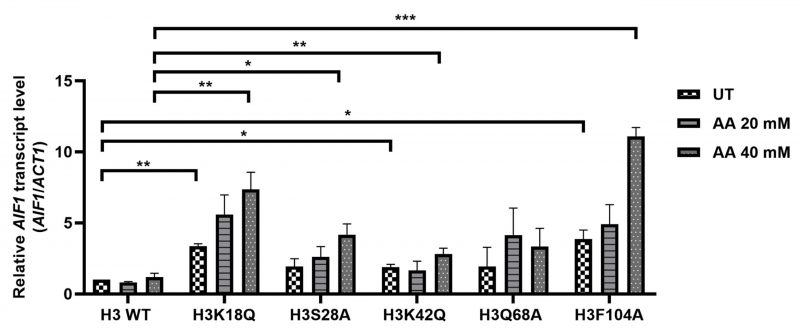
FIGURE 2: Acetic acid-sensitive mutants exhibit enhanced AIF1 gene expression levels. AIF1 mRNA level examined in the wild-type (H3 WT) and mutants under untreated (UT) or different concentrations of acetic acid (20-, 40-mM), the relative expression with respect to ACT1 gene is shown. Statistical analysis was performed through unpaired Student's t-test with Welch's correction (GraphPad Prism 8 GraphPad Software, Inc). The mean ± SD of three biological replicates (n= 3) are shown. ***p < 0.001, **p (0.001 to 0.01), *p (0.01 to 0.05).