
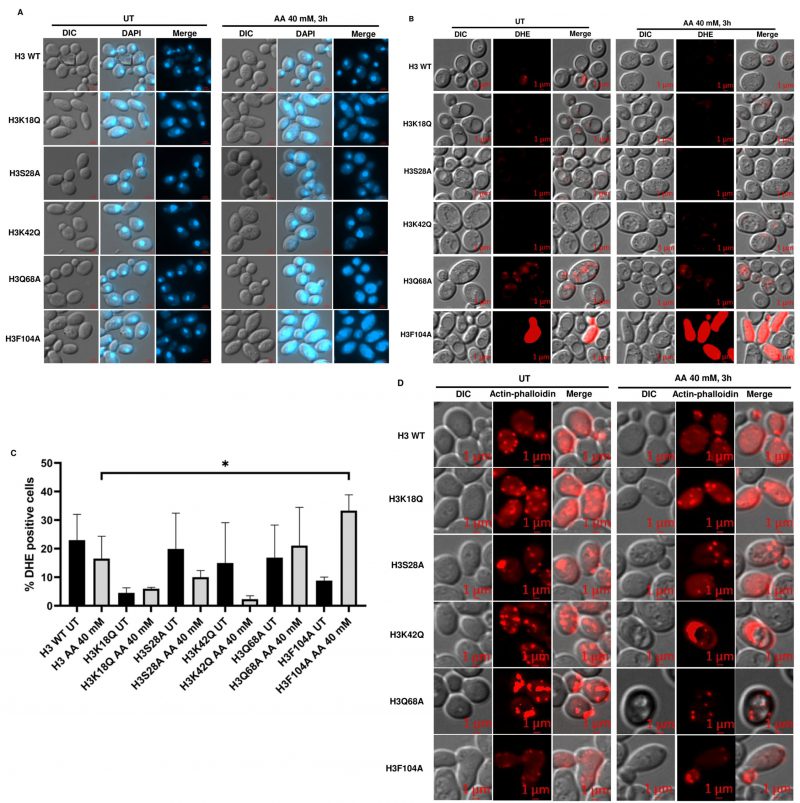
FIGURE 4: Acetic acid-sensitive mutants exhibit chromatin fragmentation, enhanced ROS generation and aggregated actin cytoskeleton after treatment with acetic acid. (A) DAPI (B) DHE (for ROS) (C) Quantification of DHE+ cells. (D) Actin-Phalloidin (for actin cytoskeleton) staining images of H3 WT and the mutant cells, which were grown till an absorbance of ∼1 at 600 nm and then left untreated (UT) or treated with acetic acid for the indicated time and concentration. ***p < 0.001, **p (0.001 to 0.01), *p (0.01 to 0.05).