Back to article: Replicative aging in yeast involves dynamic intron retention patterns associated with mRNA processing/export and protein ubiquitination
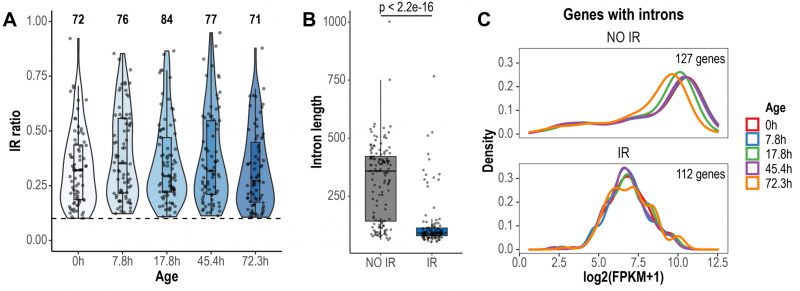
FIGURE 1: Global detection and characteristics of retained introns during replicative yeast aging. (A) Violin plots displaying IR ratio distribution of the 116 retained introns identified across all aging time points. Each point is an intron. The dashed line indicates the threshold value of IR ratio for an intron to be considered as retained (IR ratio > 0.1). The number of retained introns identified in each time point is indicated at the top. (B) Box plots displaying the distribution of the lengths of non-retained (NO IR) and retained introns (IR). Only the introns of genes with Fragments Per Kilobase of transcript per Million reads mapped (FPKM) > 1 are shown. Significance was tested using Wilcoxon rank sum test (p < 2.2e-16). (C) Expression levels of genes with non-retained introns and genes expressing IR transcripts. Only genes with FPKM > 1 are shown. Note that the density curves, which represent the distribution of the data, are shifted towards lower expression values in genes expressing IR transcripts.

