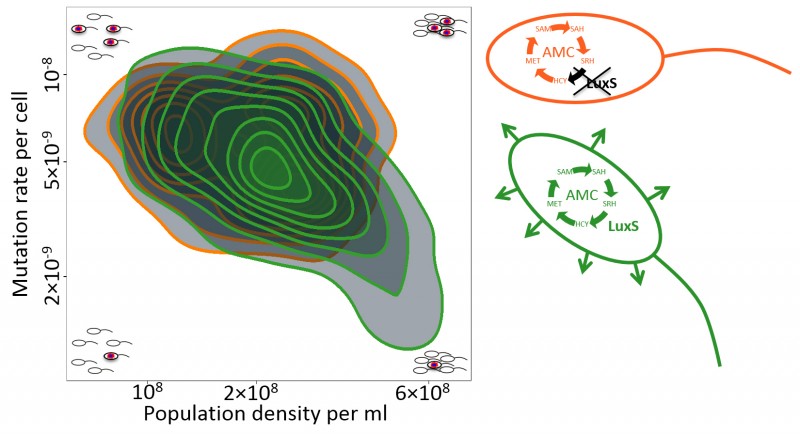
FIGURE 1: Density-dependent mutation rate plasticity in E. coli.
The green contours indicate mutation rates for E. coli with a functional Activated Methyl Cycle (AMC; green cell) across a range of population densities. In the example cells in the plot corners, a blue and red explosion indicates a mutational event resulting in a rifampicin resistant cell. The orange contours correspond to luxS deletant cells which don’t produce the signal (arrows coming from the green cell) and have an incomplete AMC (orange cell). Contours are density plots across all the data from Krašovec et al. 2014 (344 data points, 77 of which correspond to the orange contours), including both E. coli B and K12 strains and accounting for all the effects noted there (e.g., data from the complemented ΔluxS mutant are included in the green area, not the orange).
Abbreviations: HCY, homocysteine; MET, methionine; SAM, S-adenosylmethionine; SAH, S-adenosylhomocysteine; SRH, S-ribosylhomocysteine.

