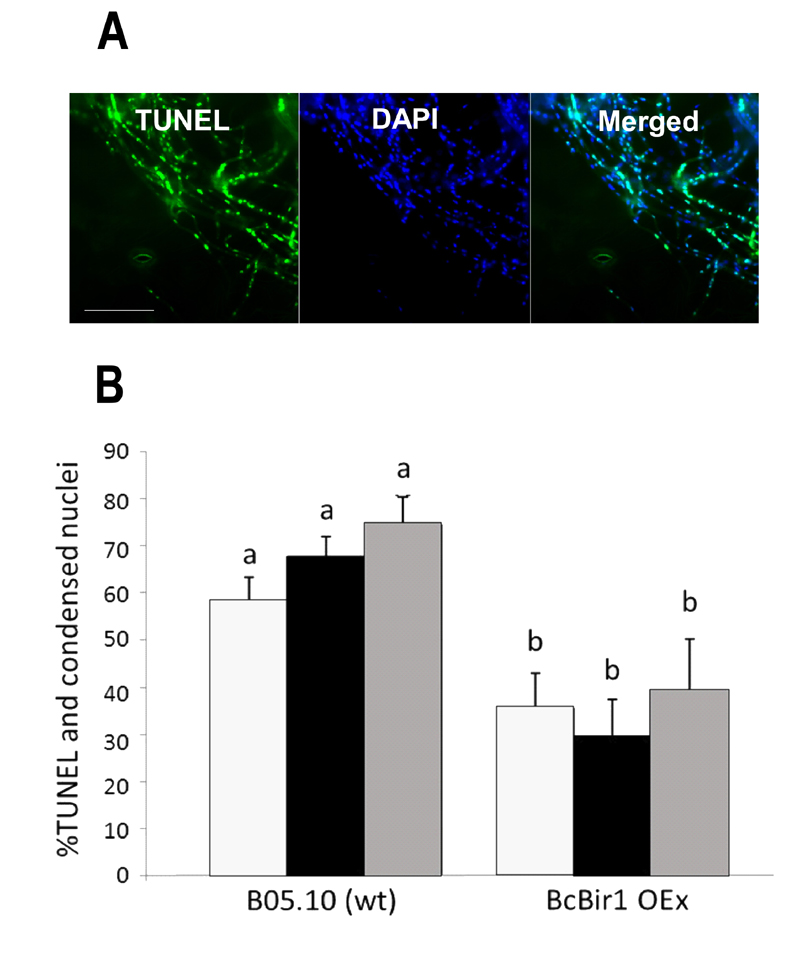
FIGURE 6: Quantification of TUNEL and comparison with chromatin condensation.
(A) Images of infected leaves stained with TUNEL and DAPI. Leaves of A. thaliana cv. Col-0 were inoculated with conidia of B. cinerea wild type strain. TUNEL assay and DAPI staining were performed 48 h post inoculation, when massive PCD occurs in the fungus. TUNEL positive nuclei are detected in the GFP channel (left), DAPI-stained nuclei (all nuclei, including TUNEL positive and negative) are detected in the DAPI channel (middle). Yellow signal in the merge image indicates double stained nuclei (right). Bar = 20 µm.
(B) A bar graph showing levels of TUNEL and DAPI stained nuclei. Cultures of wild type and a BcBir1 over expression (less sensitive to apoptosis) strains were produced in PDB at 22°C with agitation. After 24 h H2O2 was added to a final concentration of 10 mM and the cultures were incubated under the same conditions for additional 4 h. Mycelia were harvested, samples were processed for the TUNEL assay, and then stained with DAPI before microscopic visualization at 1000x magnification. The percent of TUNEL-positive nuclei was estimated manually (black bars) and by the TUNEL module of the software (grey bars). Percent of nuclei with condensed DNA was determined in the same samples using the Condensation module of the SCAN© software (white bars). Percentage of condensed and TUNEL-positive nuclei in untreated cultures was below 15% and 0.5%, respectively (not shown). All data are the mean average ± SEM of triplicate samples, each containing at least 200 nuclei per sample (n = 3). Columns and lines not connected with the same letter are statistically different according to two-way ANOVA (P < 0.05) followed by a post-hoc Tukey HSD analysis (P < 0.001).

