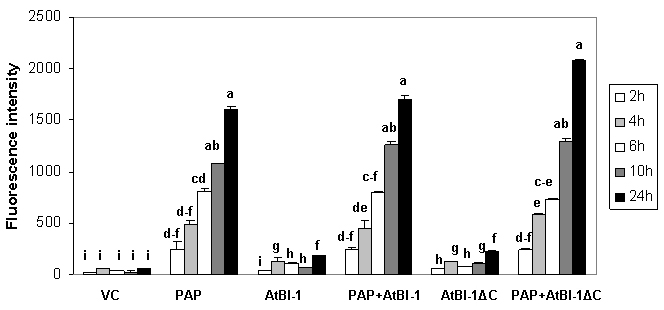
FIGURE 2: ROS generation in cells expressing PAP and AtBI-1.
The amount of H2O2 production was quantified using DCDHF-DA. The results are represented as the means ± standard deviation (n=3). VC – vector control. The results represent three independent experiments. Columns are statistically different according to ANOVA (P < 0.001) followed by a post-hoc Fisher’s Least Significant Difference (LSD) test.

