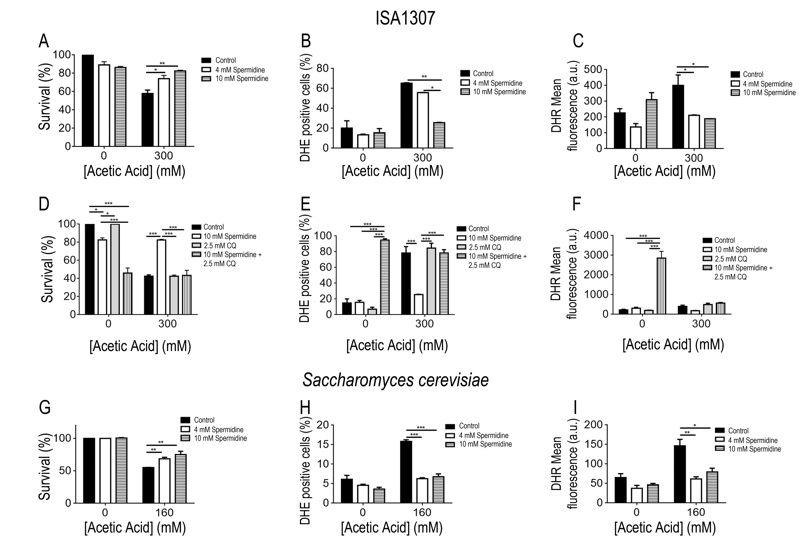
FIGURE 5: Spermidine protects cells from acetic acid – induced PCD.
Comparison of the survival rate of (A) ISA1307 and (G) Saccharomyces cerevisiae cells treated with the described concentration of acetic acid combined with 4 mM or 10 mM spermidine. FACS measurements of superoxide anions (B and H) using the probe dihydrioethidium and hydrogen peroxide (C and I) using the probe dihydrorhodamine 123 (DHR) in ISA1307 and S. cerevisiae cells, respectively. (D) Survival rate and FACS measurements of (E) superoxide anions and (F) hydrogen peroxide (DHR) of ISA1307 cells treated with 300 mM of acetic acid combined with 10 mM spermidine and the autophagy inhibitor chloroquine (CQ) at 2.5 mM. Bar graphs indicate mean and standard error of the mean (SEM). Fluorescence/cell (arbitrary units) measured in 25,000 cells/sample in three independent experiments. Significance of the data was determined by two-way ANOVA (*P < 0.05; **P < 0.01; ***P < 0.001).

