
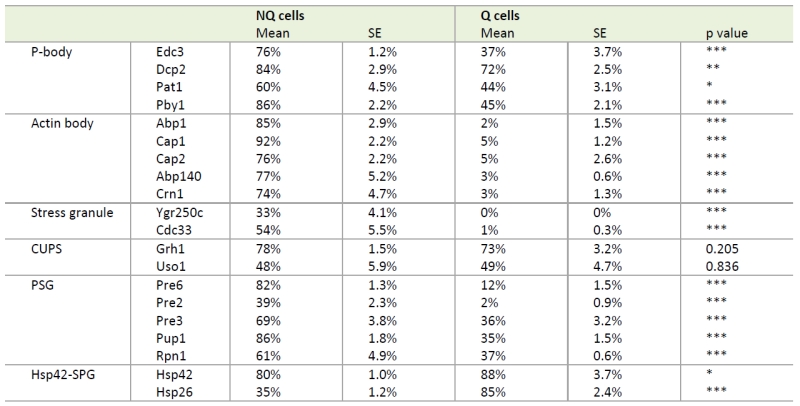
TABLE 1. Formation frequencies of stationary phase-specific granules in Q and NQ cells.
Percentages of cells displaying granule structures are shown. The representative images of granule-containing cells of different strains are shown in Figures 1 and S2. At least 3 samples were analyzed for each strain and at least 100 cells were counted in each sample. S.E.: standard errors. p values were calculated using the two-tailed Student’s t-test. *: p < 0.05; **: p < 0.01; ***: p < 0.005.