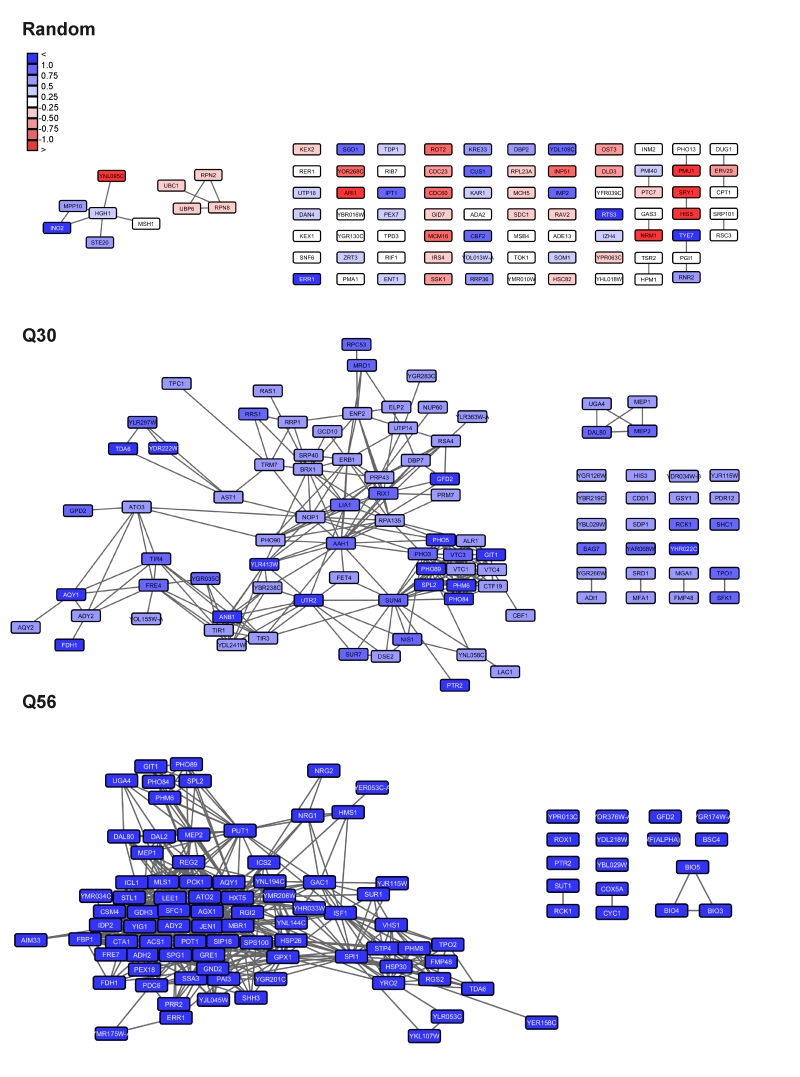
FIGURE 3: Analysis of network connectivity based on the number of initial hits. Connections between hits derived from the Q56- and Q30 datasets were calculated based on a variable number of hits. The top30-top300 most strongly regulated hits were used to construct a network. A) Depicted are the number of hits, which are included in the interconnected network and B) the average number of connections per hit. As a control 100 random sets of genes were used and processed in the same manner. The error bar represents the standard deviation for the 100 random gene lists.
By continuing to use the site, you agree to the use of cookies. more information
The cookie settings on this website are set to "allow cookies" to give you the best browsing experience possible. If you continue to use this website without changing your cookie settings or you click "Accept" below then you are consenting to this. Please refer to our "privacy statement" and our "terms of use" for further information.

