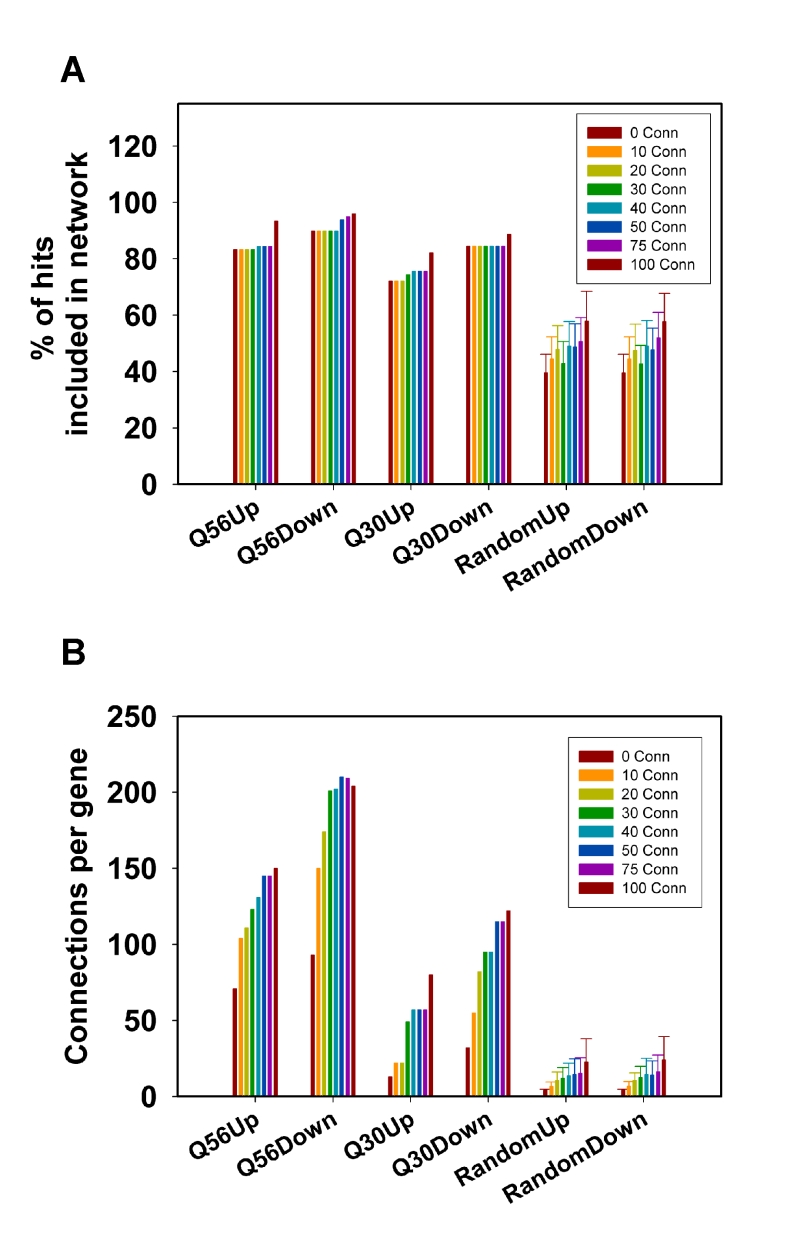
FIGURE 5: Evaluation of parameters for different experimental setups. Different microarray experiments were used to test the general applicability of the clustering approach, the connectivity parameters and the CoRegScore. A) Depicted here is the percentage of hits included within the network upon analysis of the top100 connected by 20 co-regulators obtained from SPELL. B) The average number of connections per hit is shown under the same conditions. C) The CoRegScore is calculated for each data set after addition of up to 50 connectors and compared to the values for random data sets derived before.
By continuing to use the site, you agree to the use of cookies. more information
The cookie settings on this website are set to "allow cookies" to give you the best browsing experience possible. If you continue to use this website without changing your cookie settings or you click "Accept" below then you are consenting to this. Please refer to our "privacy statement" and our "terms of use" for further information.

