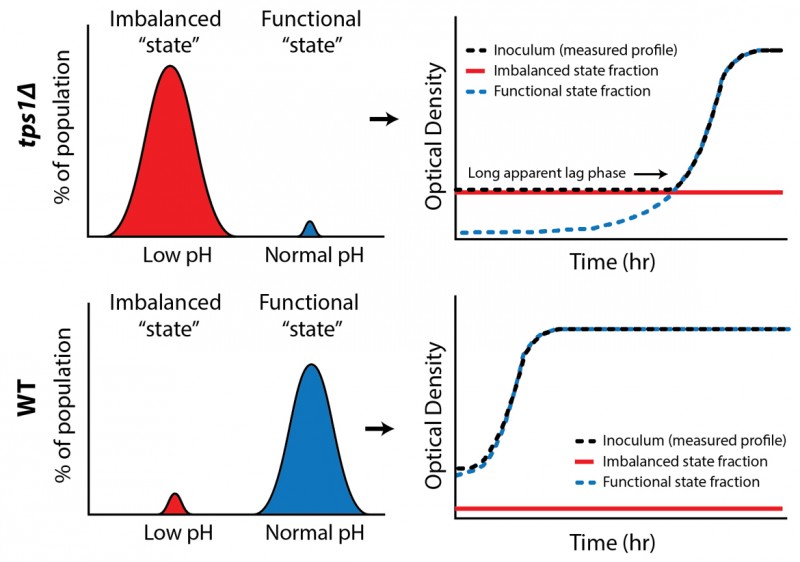
FIGURE 1: Bistability in glycolysis leads to two distinct subpopulations. Intracellular pH measurements reveal such metabolic subpopulations, with sizes that correspond to observed growth behaviors.
By continuing to use the site, you agree to the use of cookies. more information
The cookie settings on this website are set to "allow cookies" to give you the best browsing experience possible. If you continue to use this website without changing your cookie settings or you click "Accept" below then you are consenting to this. Please refer to our "privacy statement" and our "terms of use" for further information.

