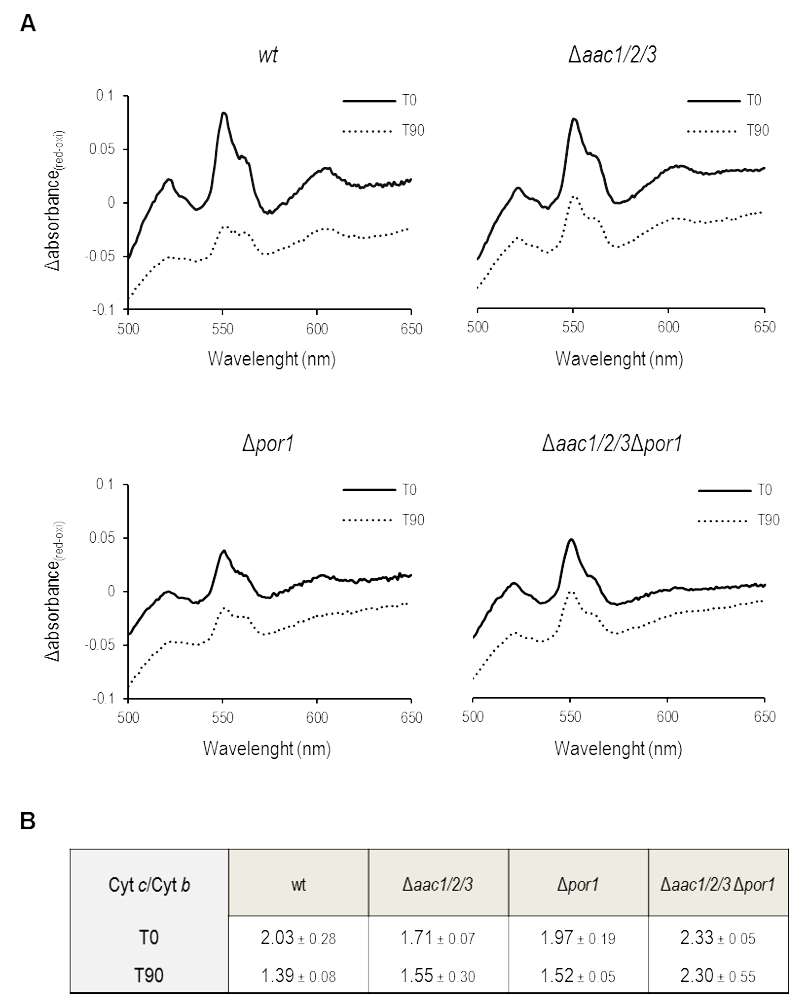
FIGURE 2: Mitochondria lacking the AAC proteins retain most of their cyt c after acetic acid treatment.
(A) Cells were pre-cultured in YPD, and then grown O.N. in YPGal until an OD640nm of 1.5-2.0 was reached, before adding acetic acid. Redox difference spectra of mitochondria isolated from wt, Δaac1/2/3, Δpor1 and Δaac1/2/3Δpor1 control (full lines) or acetic acid-treated cells (dotted lines) are shown. Each graphic corresponds to one representative experiment from each tested strain. Peaks at 500 nm represent the amount of cytochromes c + c1 while peaks at 561 nm represent the content of cytochrome b.
(B) The corresponding cyt c/cyt b ratios estimated for wt, Δaac1/2/3, Δpor1 and Δaac1/2/3Δpor1 mitochondria extracted from control and acetic acid-treated (180 mM, 90 minutes) cells are represented in the lower table. Data represent mean ± SD of at least 3 independent experiments.

