
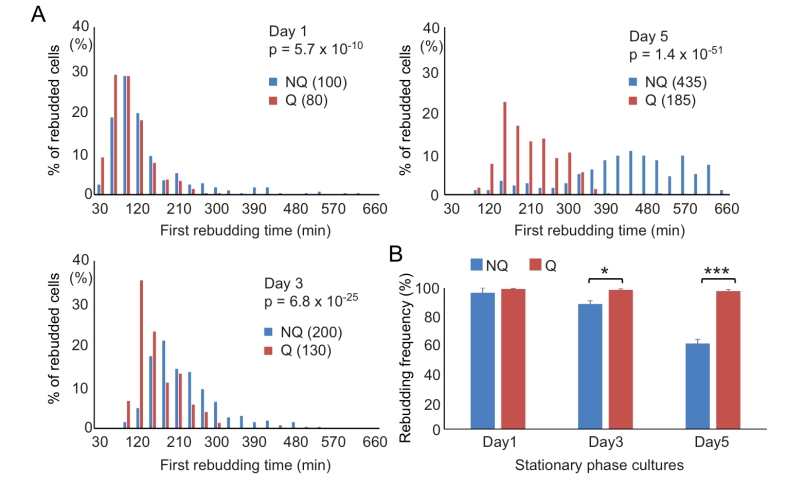
FIGURE 4: NQ cells have lower recovery speeds and viability than Q cells. (A) NQ cells take more time to return to the cell cycle than Q cells. Cells growing in YPD for different days were supplied with fresh medium and then time-lapse images were acquired at 10-minute intervals continuously for 10 hours. The first rebudding time of each cell was recorded and the distribution is shown. Numbers in parentheses are the median values of the first budding time (min) in Q and NQ populations. At least 200 cells were counted in each sample, except for the 5-day NQ cells (n = 182). p values were calculated using the Mann-Whitney U test. (B) NQ cells quickly lose their ability to rebud. The proportions of Q and NQ cells that rebudded within 10 hours are shown. It has been shown previously that most cells permanently lose their reproductive ability if they do not rebud within 10 hours after the addition of fresh media [19]. Three repeat experiments were performed. p values were calculated using the two-tailed Student’s t-test. *: p < 0.05; ***: p < 0.005. Error bars represent the standard error.