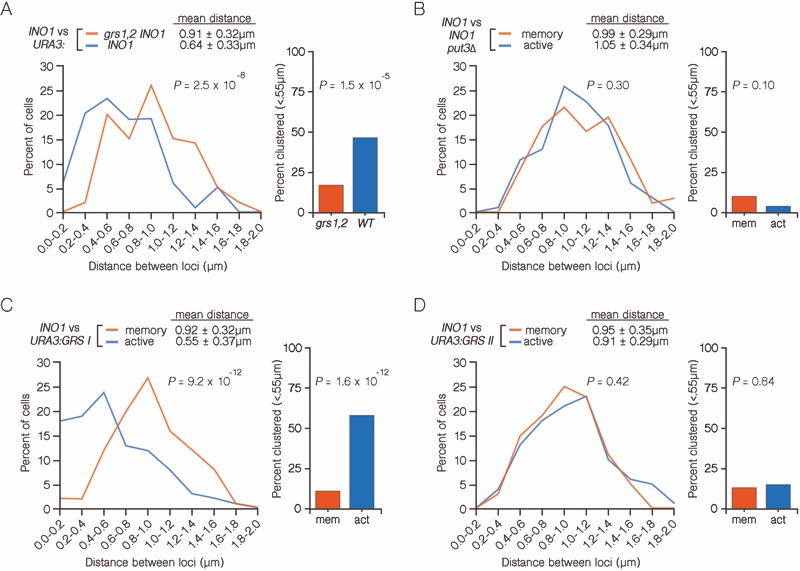
FIGURE 4: INO1 interchromosomal clustering during transcriptional memory requires clustering of active INO1. (A and B) Haploid cells having the LacO array integrated at URA3 and the TetO array integrated at INO1, and expressing GFP-TetR and mRFP-LacI were fixed and processed for immunofluorescence against GFP and mRFP. Left: The distribution of distances between the two loci in ~ 100 cells, binned into 0.2 µm bins. P values were calculated using a Wilcoxon Rank Sum Test. Right: the fraction of cells in which the two loci were ≤ 0.55 µm. P values were calculated using a Fisher Exact Test.
(A) INO1-TetO vs. URA3:INO1-LacO or URA3:grs1,2 INO1-LacO grown under memory conditions.
(B) INO1-TetO vs. URA3:GRS I-LacO under either activating or memory conditions.
(C) INO1-TetO vs URA3:GRS II-LacO under activating or memory conditions.
(D) INO1-TetO vs. URA3:INO1-LacO put3∆ cells under activating or memory conditions.

