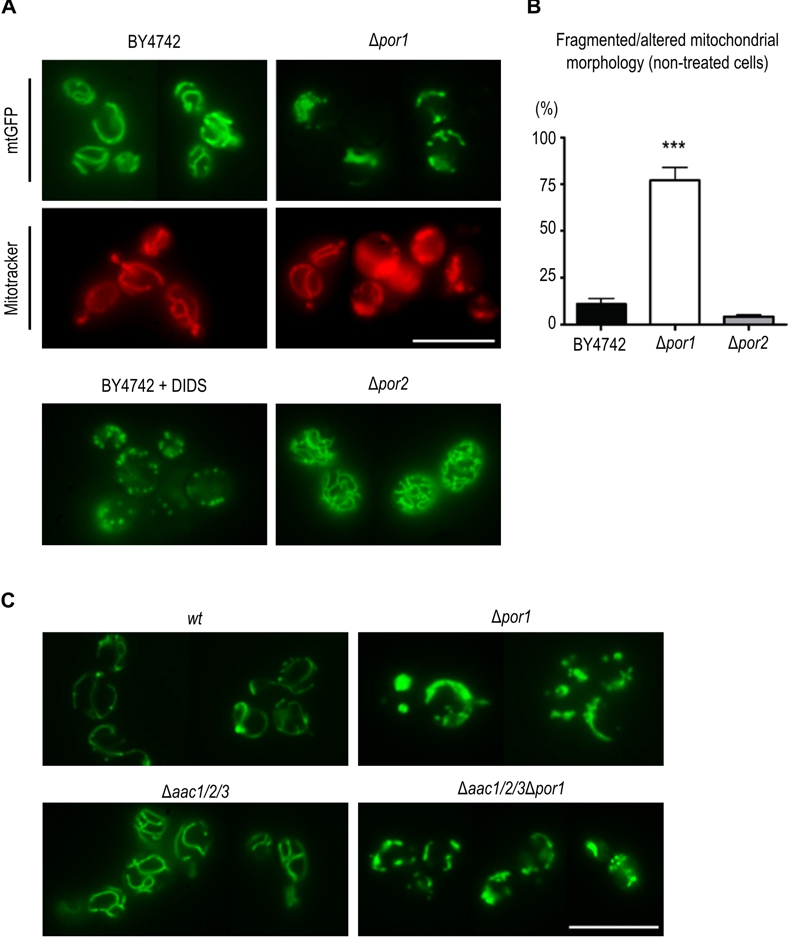
FIGURE 4: Por1p contributes to fusion in non-treated, healthy cells.
(A) Mitochondrial morphology of BY4742, Δpor1 and Δpor2 cells, grown O.N. in SC Gal medium supplemented with the appropriate amino acids, was visualized by expression of a mitochondria matrix-targeted GFP. The BY4742 strain was treated for 5 min with 0.5 mM of the anion channel inhibitor, DIDS. Mitochondrial morphology in BY4742 and Δpor1 strains was also visualized by Mitotracker Red straining. Bar = 10μm.
(B) Quantification of fragmented mitochondrial morphology (%) for strains BY4742, Δpor1 and Δpor2 is shown. Values are means ± SD of four independent experiments. *** P < 0.001, unpaired t-test.
(C) Mitochondrial morphology in Δaac1/2/3 and Δaac1/2/3Δpor1 strains expressing a matrix targeted GFP grown O.N. in SC Gal medium supplemented with the appropriate amino acids. Bar = 10 μm.

