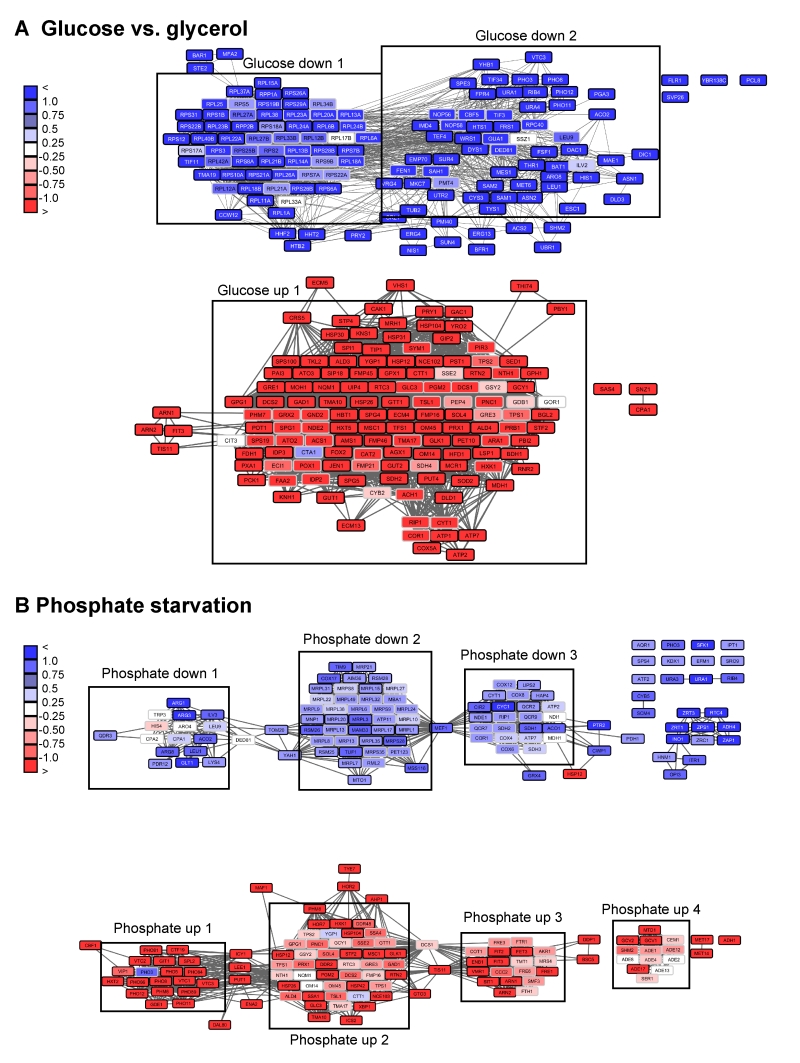
FIGURE 6: Visualization of networks upon glucose-depletion and phosphate starva-tion. The top 100-hits of different datasets were connected in ClusterEx and visualized in Cytoscape. Connectivity is retrieved as described by obtaining 20 coregulators from SPELL and including 50 connectors. The edge-weighted spring embedded layout is used to position highly connected genes in close proximity in Cytoscape. Genes are colored according to their log differences in the respective experiments. Clusters which are further analyzed for their GO-terms via PANTHER and for their transcription factors via the YEASTRACT web service are marked with black boxes. A) Genes differentially regulated in S. cerevisiae upon growth on the carbon sources glucose versus glycerol [32] were built into an interconnected network. The top100 hits (black frame) and 50 connectors (grey frame) were included into the network. Upper panel: downregulation, lower panel: upregulation. B) Genes differentially regulated in S. cerevisiae upon phosphate starvation [27] were built into an interconnected network. The top100 hits (black frame) and 50 connectors (grey frame) were included in the network. Upper panel: downregulation, lower panel: upregulation.
27. Zhou X, O’Shea EK (2011). Integrated approaches reveal determinants of genome-wide binding and function of the transcription factor Pho4. Mol Cell 42(6): 826-836. http://dx.doi.org/10.1016/j.molcel.2011.05.025
37. Levy S, Ihmels J, Carmi M, Weinberger A, Friedlander G, Barkai N (2007). Strategy of transcription regu-lation in the budding yeast. PLoS One 2(2): e250. http://dx.doi.org/10.1371/journal.pone.0000250

