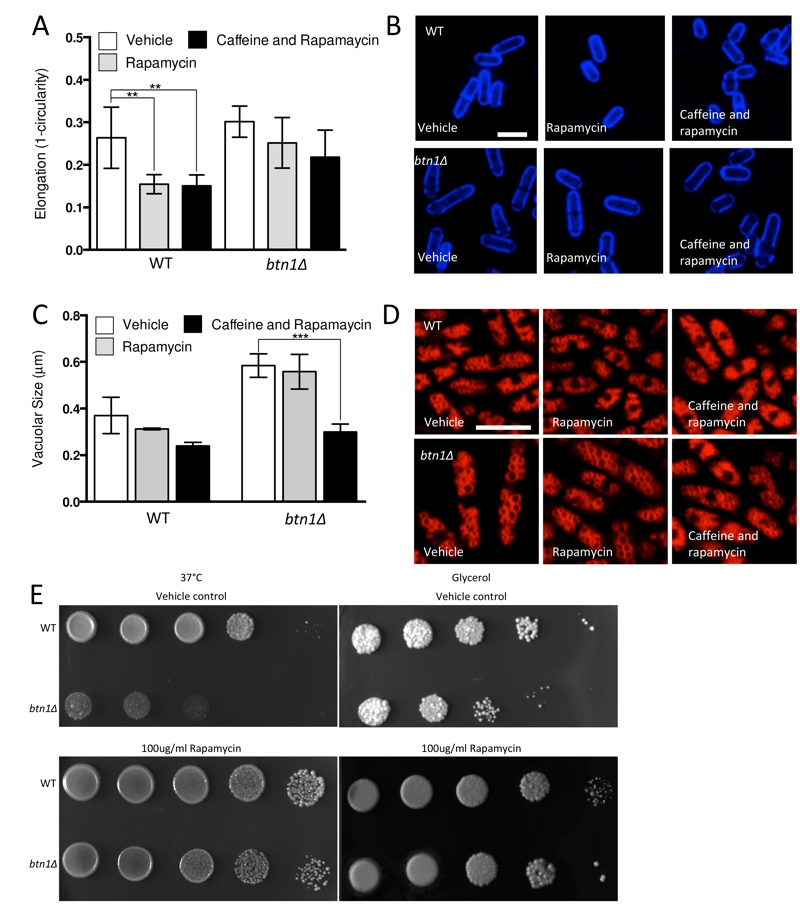
FIGURE 6: Pharmacological inhibition of TORC1 function replicates rescue by overexpression of dominant-negative rhb1.
(A) The morphological response of wild-type (WT) and btn1Δ cells to the TORC1 antagonists rapamycin (100 μg/ml) and caffeine and rapamycin combined (10 mM and 100 μg/ml respectively) was analysed following 6 hours in culture using a measure of cell elongation, on a scale of 0 to 1, where 0 represents a perfectly round cell (1-(4π*area/perimeter2)). Data shown is a mean (± SEM) of 6 independent experiments. Statistical significance between each condition was determined using a one-way ANOVA with a Tukey’s multiple comparison post-test (** = P < 0.01).
(B) Representative images of experiments as performed in (A) are shown. Scale bar represents 10 μm.
(C) Wild-type and btn1Δ cells were grown for 6 hours in MM alone or with the TORC1 antagonists rapamycin (100 μg/ml) and caffeine and rapamycin (10 mM and 100 μg/ml respectively). Vacuole size was then measured in these cells following staining with the vital dye FM4-64. The diameter of 300 vacuoles was measured per data set, and data shown is a mean (± SEM) of 4 independent experiments. Statistical analysis was performed using a one-way ANOVA with a Tukey’s multiple comparison post-test (*** = P < 0.001).
(D) Representative images of experiments as performed in (C) are shown. Scale bar represents 10 μm.
(E) WT and btn1Δ cells were serially diluted from a log-phase culture (1 x 10⁶ cells/ml) and spotted onto YES plates either containing or lacking rapamycin (100 μg/ml). Plates were then incubated at 37°C for 3-4 days to determine growth at high temperature. They were also spotted onto plates containing glycerol as a carbon source either containing or lacking rapamycin (100 μg/ml). Plates were then incubated at 30°C for 6-7 days to determine growth under non-fermentative conditions. Images are representative of three independent experiments.

