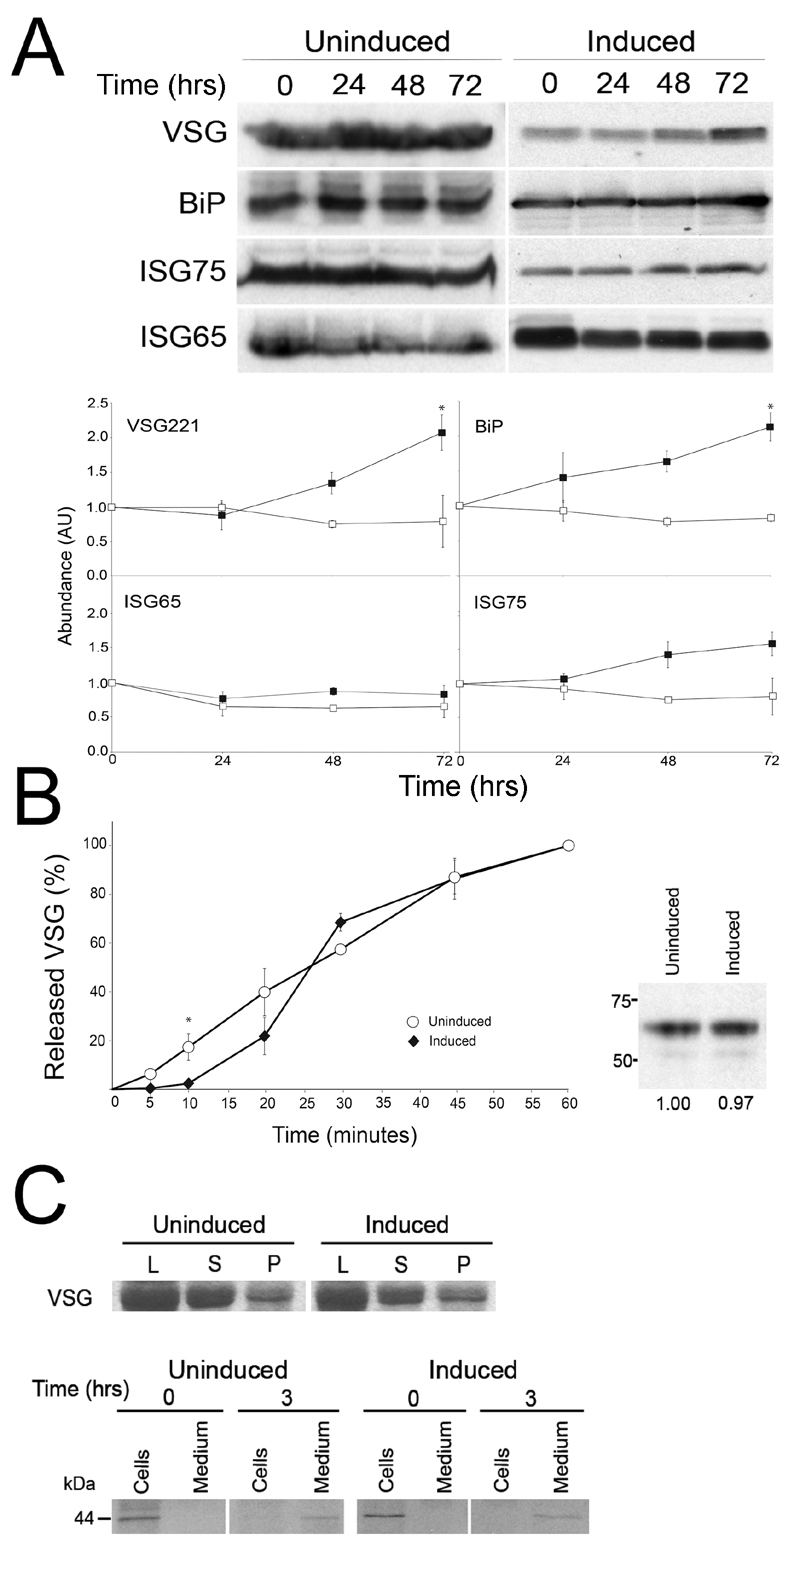
FIGURE 9: Effects of IGP knockdown on major surface protein copy number and exocytosis.
(A) Cells were sampled from either induced or uninduced IGP48 RNAi cell lines at the times indicated. Membranes were probed with anti-VSG221, TbBiP, ISG65, or ISG75 and relative protein abundance was determined by densitometry. Experiments were done in duplicate and bars indicate standard error of the mean. Data were normalised to 100% at t = 0.
(B) Export of newly synthesised VSG in induced and uninduced IGP48 RNAi cells. Surface accessible VSG was hydrolysed by GPI-PLC after hypotonic lysis of the cells. Soluble and membrane-form VSG was recovered by incubation with ConA-sepharose. Data represent the kinetics of newly synthesised VSG transported from the endomembrane system to the cell surface, shown as percent of VSG at the cell surface. Data were taken from two independent experiments and standard error of the mean is shown. Student’s t-test showed statistically significant difference between induced and uninduced cells at the time point indicated with an asterisk (p < 0.05). Right panel: Metabolic labelling of newly synthesised VSG following 24 hour RNAi induction. Newly synthesised VSG was labelled with 35S-methionine and detected by autoradiography.
(C) Top: Hypotonic lysis, followed by separation of surface (supernatant, S) and intracellular (pellet, P) VSG 221 was visualised by SDS-PAGE and Commassie staining and levels of VSG compared to that in whole cell lysates (L). No significant difference in VSG distribution is seen between induced and uninduced cells. Lower: Levels of the BiPN reporter following labelling of cells with 35S-methionine were detected in induced and uninduced cells, following a 3 hour chase. No significant change is seen between export of BiPN from the cell in induced compared to uninduced trypanosomes.
For figures in higher resolution please refer to PDF version of the article.

