
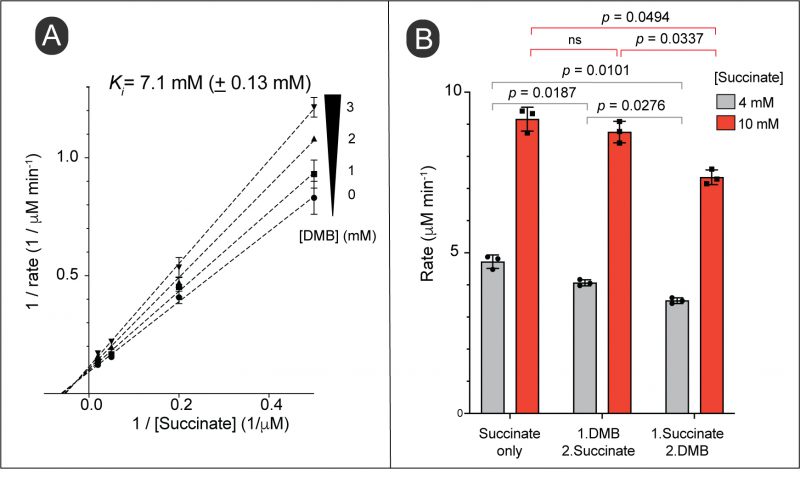
FIGURE 9: DMB inhibits succinate dehydrogenase in vitro. (A) Double-reciprocal plot of initial reaction velocities of succinate dehydrogenase at varying concentrations of succinate and different fixed concentrations of DMB as indicated. Error bars represent standard deviation of two technical replicates and each experiment was replicated twice, with a representative graph shown. The Ki was calculated by a noncompetitive inhibition model fit using Prism (GraphPad, version 9). Standard deviation of two independent experiments is shown. (B) Effect of the order of adding DMB into the reaction mixture for its inhibition. Reactions were set up adding all the reaction components as described in Materials and Methods except succinate and DMB; incubated at RT for 5 min. DMB (3 mM) or succinate was added to the reaction as indicated and further incubated for 30 s at room temperature. The second missing component (either succinate or DMB) was added and progress of the reaction was monitored as described in Materials and Methods. We verified the all the reactions were within the linear range of the reaction progress when initial velocities were calculated (data not shown). A paired Student's t test was performed to determine statistical significances; ns, not significant. Initial reaction rates were calculated using crude extracts of S. Typhimurium grown in NCE minimal medium supplemented with succinate as the main source of carbon and energy.