
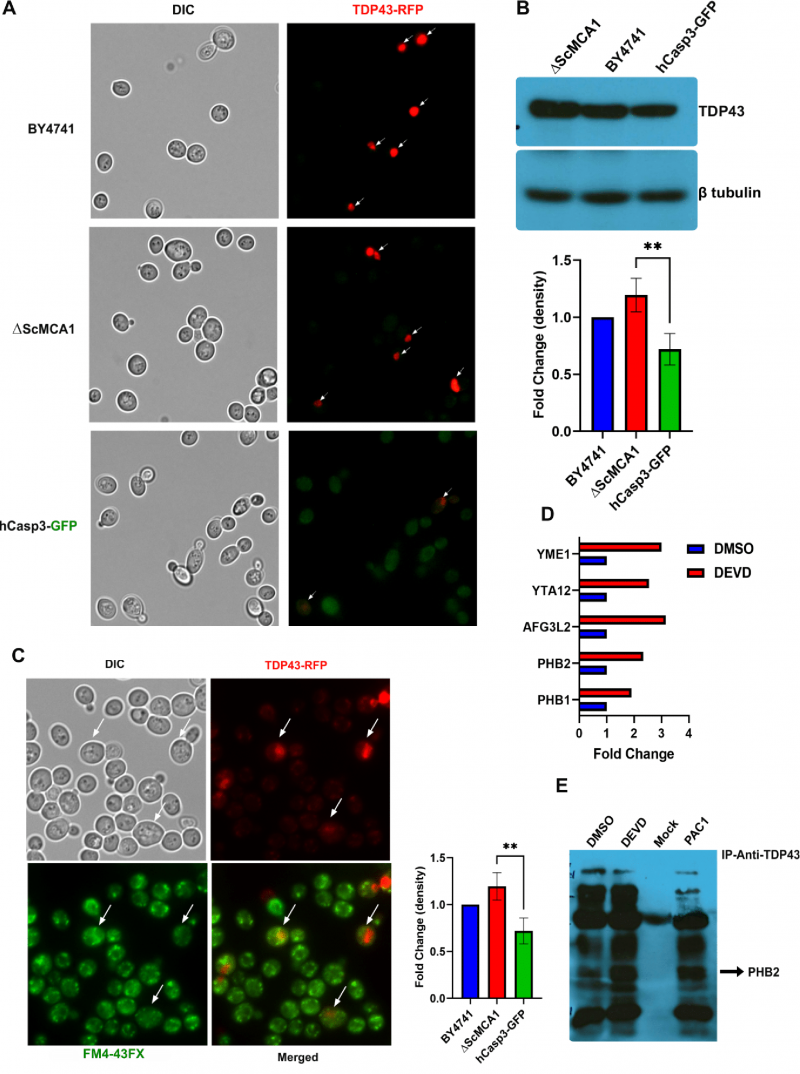
FIGURE 2: Human Caspase 3 inhibits TDP43 protein aggregation. (A) Representative fluorescence image showing TDP43-RFP expression (red) in three yeast strains BY4741, ΔScMCA1 and hCasp3-GFP. (B) Western blot of TDP43-RFP protein was performed in three yeast strain BY4741, ΔScMCA1, and hCasp3-FP using anti-RFP antibody. The graph represents the difference in band intensities (normalized to control BY4741) across the three strains. Values are represented as mean ± SEM with p-value < 0.05. (C) Fluorescence image of ΔScMCA1 strain showing TDP-43-RFP (red) staining and vacuole stained with FM4-43FX (green). The graph shows the difference in percentage of vacuoles (≥3 vacuoles per cell) across the three yeast strains. Values are represented as mean ± SEM with p-value < 0.05. (D) Mass Spectrometry (MS/MS) analysis of proteins immuno-precipitated with TDP43 using anti-RFP magnetic beads in hCasp3-GFP yeast strain with and without z-DEVD-FMK treatment. The graph represents proteins with high fold interaction (normalized to DMSO control) of TDP-43 post-z-DEVD-FMK treatment. (E) Representative co-immunoprecipitation blot of PHB2 with TDP43 using anti-TDP43 antibody in hCasp3-GFP yeast strain treated with DMSO, z-DEVD-FMK, and AC-1 performed in triplicates.