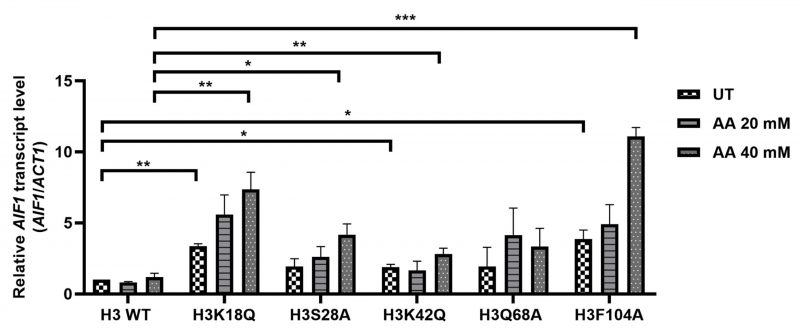
FIGURE 2: Acetic acid-sensitive mutants exhibit enhanced AIF1 gene expression levels. AIF1 mRNA level examined in the wild-type (H3 WT) and mutants under untreated (UT) or different concentrations of acetic acid (20-, 40-mM), the relative expression with respect to ACT1 gene is shown. Statistical analysis was performed through unpaired Student's t-test with Welch's correction (GraphPad Prism 8 GraphPad Software, Inc). The mean ± SD of three biological replicates (n= 3) are shown. ***p < 0.001, **p (0.001 to 0.01), *p (0.01 to 0.05).
By continuing to use the site, you agree to the use of cookies. more information
The cookie settings on this website are set to "allow cookies" to give you the best browsing experience possible. If you continue to use this website without changing your cookie settings or you click "Accept" below then you are consenting to this. Please refer to our "privacy statement" and our "terms of use" for further information.

