
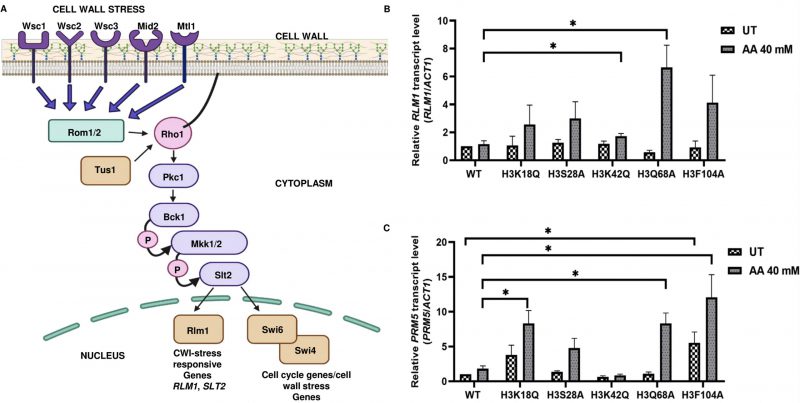
FIGURE 6: Acetic acid-sensitive mutants exhibit increased RLM1 and PRM5 expression levels indicating the involvement of the cell wall integrity pathway. (A) Schematic of cell wall stress response pathway in S. cerevisiae. (B) RLM1 or (C) PRM5 mRNA level was examined in the H3 wild-type (WT), and mutants under untreated (UT) or acetic acid treated (AA 40 mM) for 6h, the relative expression with respect to ACT1 gene is shown. Statistical analysis was performed through unpaired Student's t-test with Welch's correction (GraphPad Prism 8 GraphPad Software, Inc). The mean ± SD of three biological replicates (n = 3) are shown. ***p < 0.001, **p (0.001 to 0.01), *p (0.01 to 0.05).