Back to article: Functional link between mitochondria and Rnr3, the minor catalytic subunit of yeast ribonucleotide reductase
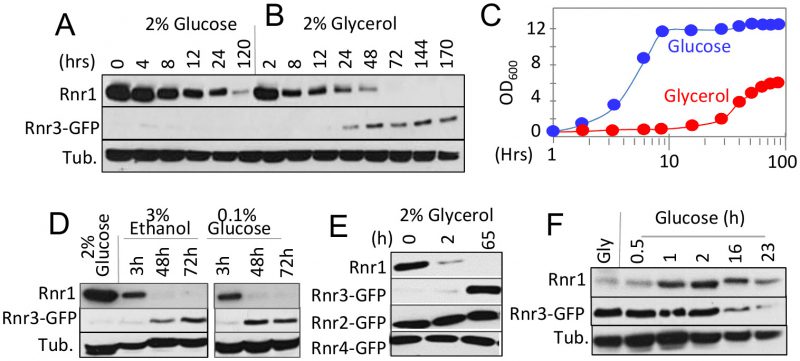
FIGURE 1: Impact of carbon source on the steady state levels of Rnr1 and Rnr3. (A, B) RNR3-GFP cells were grown to mid-log phase in synthetic complete medium supplemented with 2% glucose (SCD). The cells were collected and released into either SCD (A) or SC medium supplemented with 2% glycerol (SCG; B) for further incubation. Whole cell extract (WCE) samples were prepared at the indicated time points and subjected to Western blot analysis using α-Rnr1 and α-GFP antibodies. Tubulin was used as a loading control. (C) OD600 of the SCD (blue) and SCG (red) cultures in panels A and B at the indicated time points. (D) RNR3-GFP cells were grown to mid-log phase in SCD. The cells were collected and released into SC medium supplemented with either 3% ethanol or 0.1% glucose for further incubation. WCE samples were prepared at the indicated time points and subjected to Western blot analysis using α-Rnr1 and α-GFP antibodies. Tubulin was used as a loading control. (E) RNR2-GFP, RNR3-GFP, and RNR4-GFP strains were subjected to the glucose-to-glycerol medium switch as described in panel B. WCE samples were prepared at the indicated time points and subjected to Western blot analysis using α-Rnr1 and α-GFP antibodies. WCE preparation from the RNR3-GFP culture was used for α-Rnr1 Western blot. (F) RNR3-GFP cells were grown to mid log phase in SCG. Cells were collected and released into SCD. WCE samples were prepared at the indicated time points and subjected to Western blot analysis using α-Rnr1 and α-GFP antibodies. Tubulin was used as a loading control.

