
Back to article: Network dynamics of the yeast methyltransferome
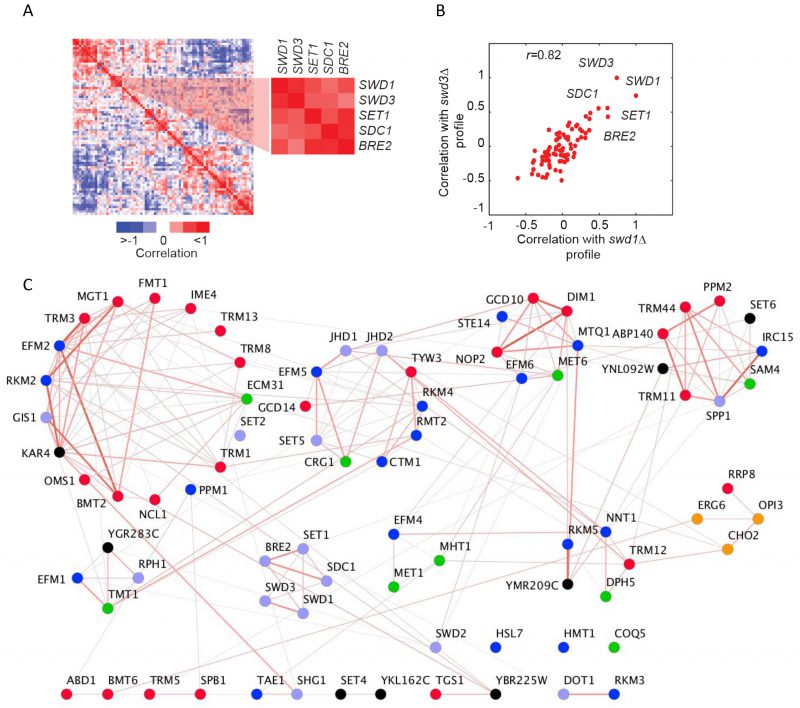
FIGURE 3: Genetic architecture of the yeast methyltransferome. (A) Correlation-based hierarchical cluster analysis. Each row/column represents a genetic interaction profile for a specific MT. A subset of positive score interactions among the components of COMPASS complex is shown. Strong positive and negative correlations among MTs are indicated by red and blue colors, respectively. (B) Scatter plot of the correlation coefficients of swd1Δ and swd3Δ with their genetic profiles. The most similar profiles for components of COMPASS complex are labeled. (C) Correlation-based clusters of similar MT profiles (r > 0.5). Nodes are individual MTs, and edges are correlation coefficient-based interactions between two nodes. Nodes are colored according to a substrate type (red, tRNA; blue, protein; purple, histone, green, small molecule; black, unknown). Edge width and color (red > 0.5, grey < 0.5) represent the magnitude of similarity.