
Back to article: Network dynamics of the yeast methyltransferome
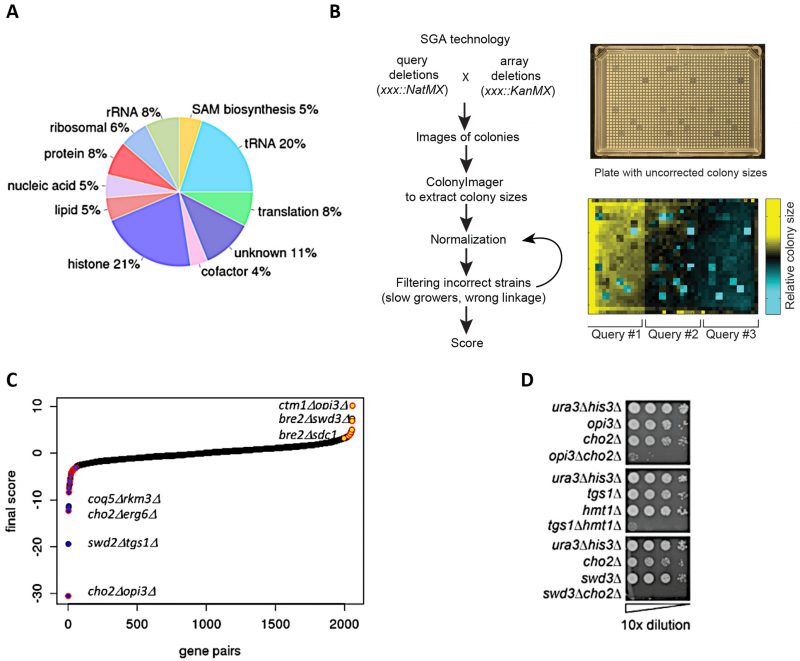
FIGURE 1: Construction of double MT mutants and evaluation of their genetic interactions. (A) Classification of methyltransferases by function/predicted substrate. (B) SGA procedure for double mutant generation and data processing. A representative image of a ‘final' plate used for the last step of selection of haploid double-deletion mutant colonies is shown. Each mutant is present in four replicates. Images are converted to pixels using Colony Imager software to obtain relative colony sizes. Each plate contains three query strains marked with NatR (mtaseΔ::NatMX) crossed to an array of KanR-marked mutants (mtaseΔ::KanMX). (C) Distribution of all MT genetic interactions; negative (blue), neutral (black) and positive (yellow); select double mutants outliers are labeled. Red outlines on each data point signify genetic interactions reported in previous studies [52]. (D) Validation of select negative genetic interactions by spot dilution growth assays, with strain genotypes indicated.
52. Oughtred R, Stark C, Breitkreutz BJ, Rust J, Boucher L, Chang C, Kolas N, O'Donnell L, Leung G, McAdam R, Zhang F, Dolma S, Willems A, Coulombe-Huntington J, Chatr-Aryamontri A, Dolinski K, Tyers M (2019). The BioGRID interaction database: 2019 update. Nucleic Acids Res 47: D529–D541. doi: 10.1093/nar/gky1079