
Back to article: Network dynamics of the yeast methyltransferome
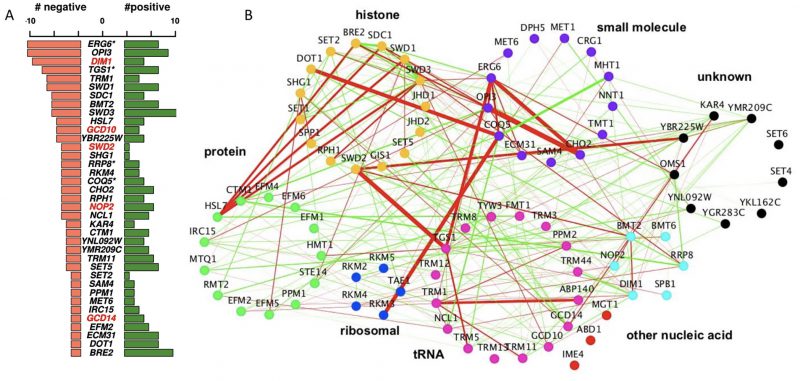
FIGURE 2: Genetic architecture of the yeast methyltransferome. (A) Frequency of high-confidence positive and negative genetic interactions (|score| >2.5) across the methyltransferome network. Essential genes are labeled in red; * indicates slow growers. (B) Genetic interaction network of the yeast methyltransferome under the standard growth condition (30°C). Each MT gene is represented as a node in the network and significant genetic interactions by edges. Nodes are colored according to the substrate type. Edge width represents the strength of the genetic, interaction score and edge color the interaction type (red negative, green positive).