
Back to article: Guidelines for DNA recombination and repair studies: Cellular assays of DNA repair pathways
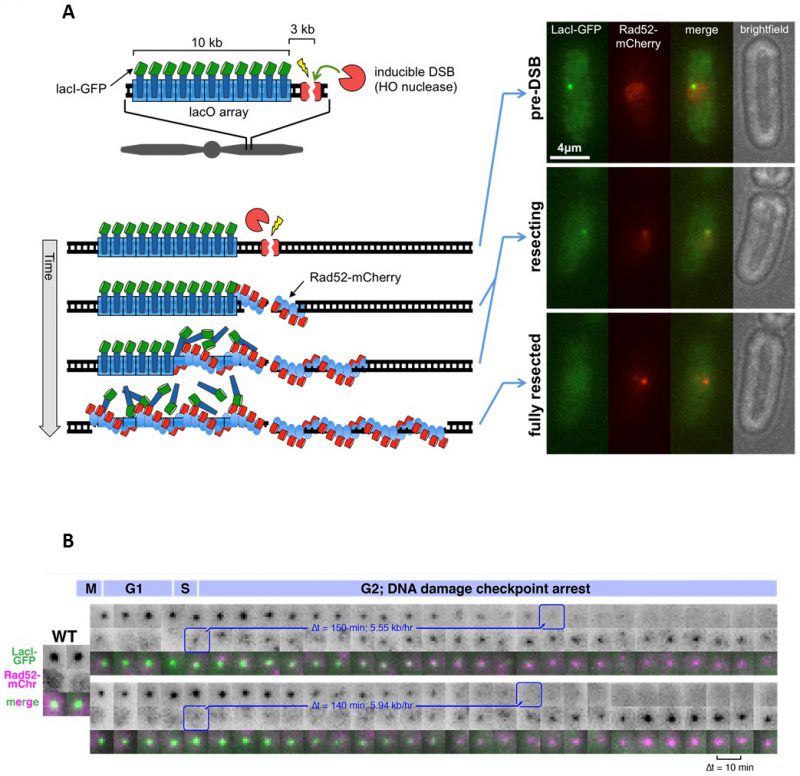
FIGURE 20: Microscopy-based assay for quantitative measurement of DSB end resection rates in single cells. (A) Cartoon diagram of the assay principles, including a recognition site for the HO nuclease adjacent to a LacO array. Resection drives loss of LacI-GFP and binding of Rad52-mCherry. On the right are examples of images that highlight the phases of DSB induction and processing. (B) Time-lapse movie of two sister cells that each form a DSB in S phase and undergo resection. The first frame when Rad52-mCherry is detected at the DSB and last frame in which the LacI-GFP focus is detected are boxed in blue. This gives rise to the resection duration, from which the resection rate can be calculated (blue). The time intervals are 10 minutes.