
Back to article: Depletion of SNAP-23 and Syntaxin 4 alters lipid droplet homeostasis during Chlamydia infection
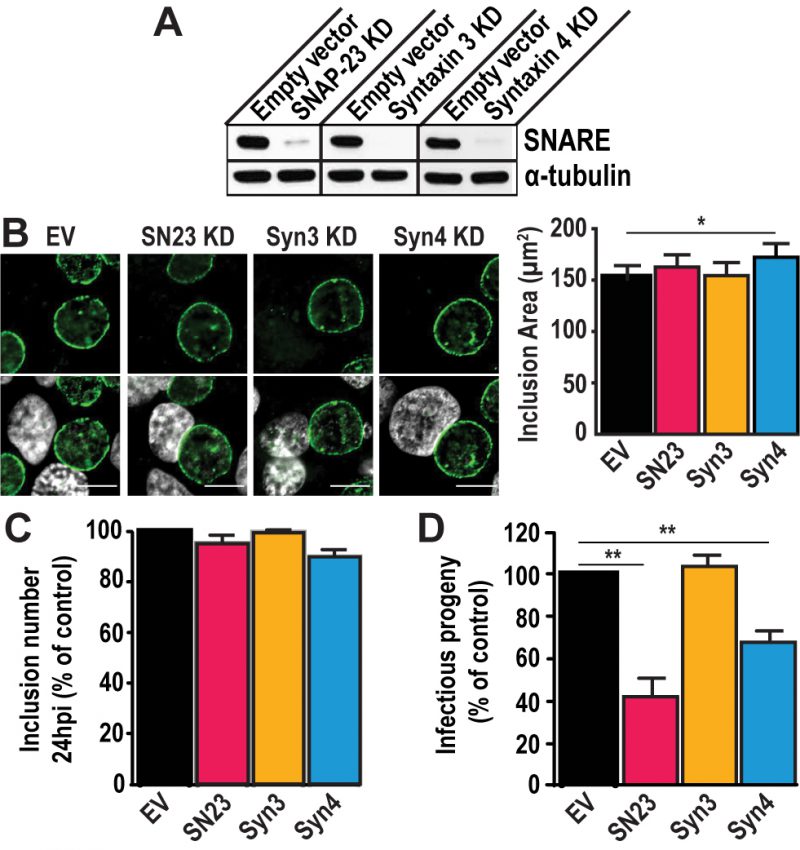
FIGURE 2: SNAP-23 and Syntaxin 4 regulate Chlamydia development. (A) Western blot analysis of protein levels in the indicated CRISPR knock down (KD) cell populations. SNARE corresponds to the t-SNARE in the KD cell line. Alpha-tubulin served as a loading control. (B) Left– The KD cell lines were infected with C. trachomatis L2 at a MOI of 0.5 for 24 h, then fixed and stained with anti-IncA antibody (green). Hoechst was used to label DNA (gray). EV = empty vector control, SN23 = SNAP-23, Syn3 = Syntaxin 3, Syn4 = Syntaxin 4, KD = knock down. Scale bar = 10 μm. Right– Graph displays the average inclusion area from three independent experiments ± the standard deviation. (C and D) Cells were infected with C. trachomatis at a MOI of 0.5. (C) At 24 h pi, cells were fixed and stained with anti-MOMP antibody. The number of inclusions per well was calculated to determine internalization and early inclusion development, assuming that one inclusion corresponded to an infection inititated by a single EB. Graph denotes the average of at least three independent experiments ± the standard deviation. For the purpose of comparison, the values obtained for the EV control were defined arbitrarily as 100% and represent 3.56×10⁵ ± 2.43×10⁴ inclusion forming units (IFU)/ml. Values for the KD cells were then normalized to the EV control. (D) At 46 h pi, cells were lysed and serially diluted on a fresh monolayer of EV control cells. Twenty-four hours later, the cells were fixed and stained with anti- MOMP antibody. Only dilutions reflecting a MOI < 1 were counted. Graph denotes the average fold change in IFU at T = 46 h compared to T = 0 h of at least three independent experiments ± the standard deviation. The fold change represents how many more IFU were present at T = 46 h compared to T = 0 h. For the purpose of comparison, the values obtained for EV control were defined arbitrarily as 100% and represent a fold change of 1,471.86 ± 153.4. Values for the KD cells were then normalized to the EV control. Asterisks denote significance, where (*) denotes a p value < 0.05 and (**) denotes a p value <0.01.