Back to article: Landscapes and bacterial signatures of mucosa-associated intestinal microbiota in Chilean and Spanish patients with inflammatory bowel disease
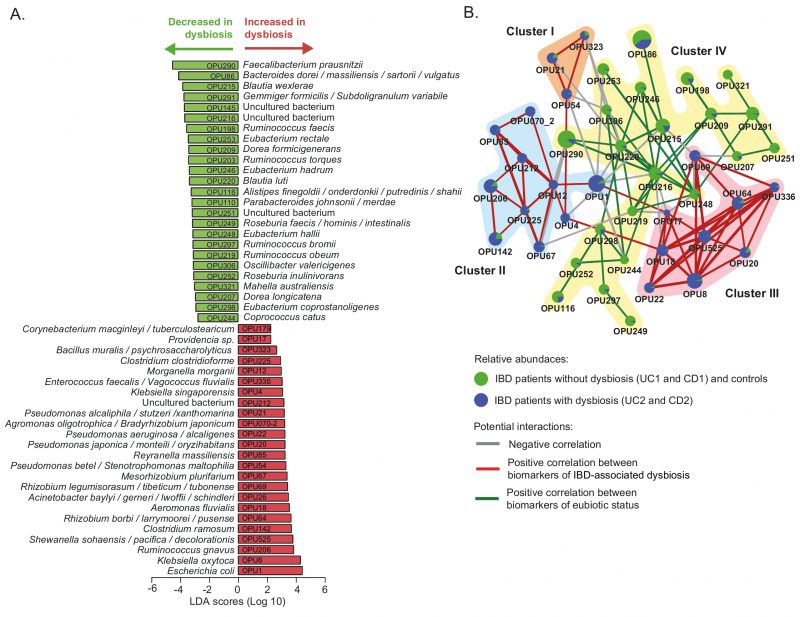
FIGURE 4: Differently abundant OPUs in dysbiotic IBD patients and their co-existence networks.(A) The LEfSe algorithm with a linear discriminant analysis (LDA) score >2 enabled the identification of OPUs that differed significantly in abundance between the dysbiotic patients (UC2 and CD2 groups) and eubiotic patients (UC1 and CD1) and non-IBD controls (B) Correlation networks of differently abundant OPUs. This analysis was performed using SparCC [57] (see methods). The nodes (pie charts) represent OPUs, with size reflecting the relative abundance in IBD patients and controls, as described in the legend. The links between nodes correspond to significant interactions (positive or negative correlations), with line width reflecting the strength of the correlation. Clusters (I to IV) of highly correlated OPUs are indicated. Unconnected nodes were omitted.
57. Friedman J, and Alm EJ (2012). Inferring Correlation Networks from Genomic Survey Data. PLoS Comput Biol 8(9): 1–11. 10.1371/journal.pcbi.1002687

