
Back to article: Landscapes and bacterial signatures of mucosa-associated intestinal microbiota in Chilean and Spanish patients with inflammatory bowel disease
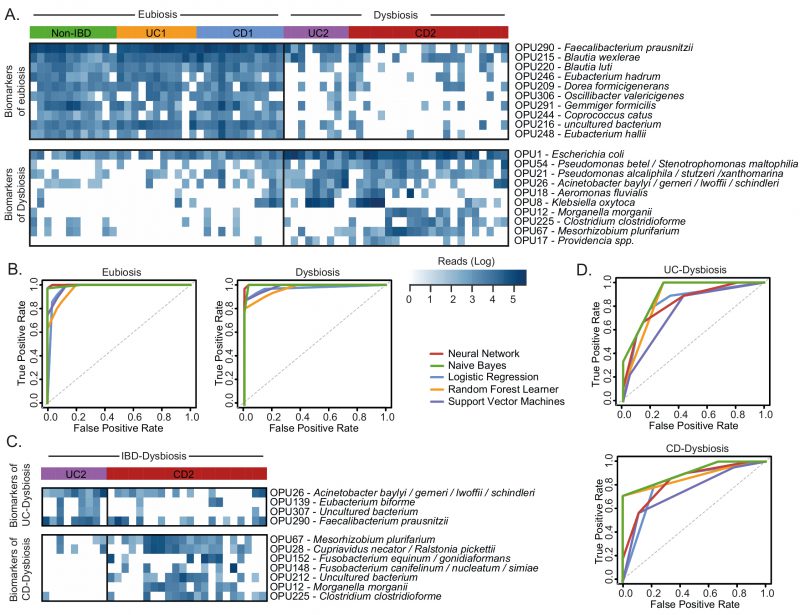
FIGURE 6: Evaluation of OPUs as biomarkers for IBD.(A) Heatmap showing the number of reads (log scale) of the best 20 indicator OPUs for dysbiosis and eubiosis in IBD. Rows represent OPUs and columns the patients ordered by groups. (B) Evaluation of five machine learning models and the above panel of twenty indicator OPUs to discriminate dysbiosis from eubiosis in the IBD patients. (C) Heatmap showing the number of reads (log scale) of the best 11 indicator OPUs for the UC (UC2) and CD (CD2) patients with dysbiosis. Rows represent OPUs and columns the patients ordered by groups. (D) Evaluation of five machine learning models and the above panel of 11 indicator OPUs to discriminate UC2 patients from CD2 patients. The diagnostic performance of each classifier model is represented by ROC curves and the area under the curve is indicated in Table 1.