
Back to article: Dry biocleaning of artwork: an innovative methodology for Cultural Heritage recovery?
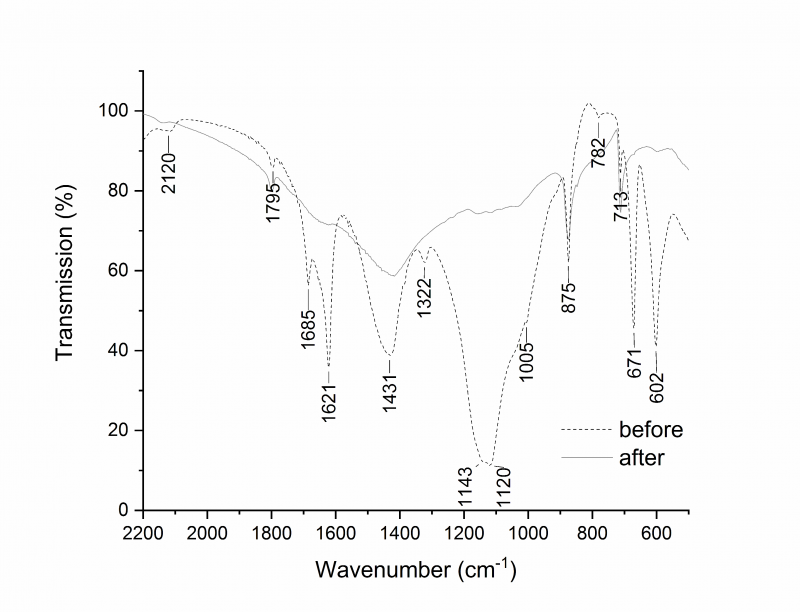
FIGURE 4: FTIR transmittance analysis of a representative area of fragment B before (dotted line) and after (solid line) the biocleaning. The spectrum recorded before the treatment (dotted line), shows the signals of calcium carbonate (1795, 1431, 875, 713 cm−1), gypsum (1685, 1621, 1143, 1120, 671, 602 cm−1) and calcium oxalate (1322, 782 cm−1).