Back to article: The first taxonomic and functional characterization of human CAVD-associated microbiota
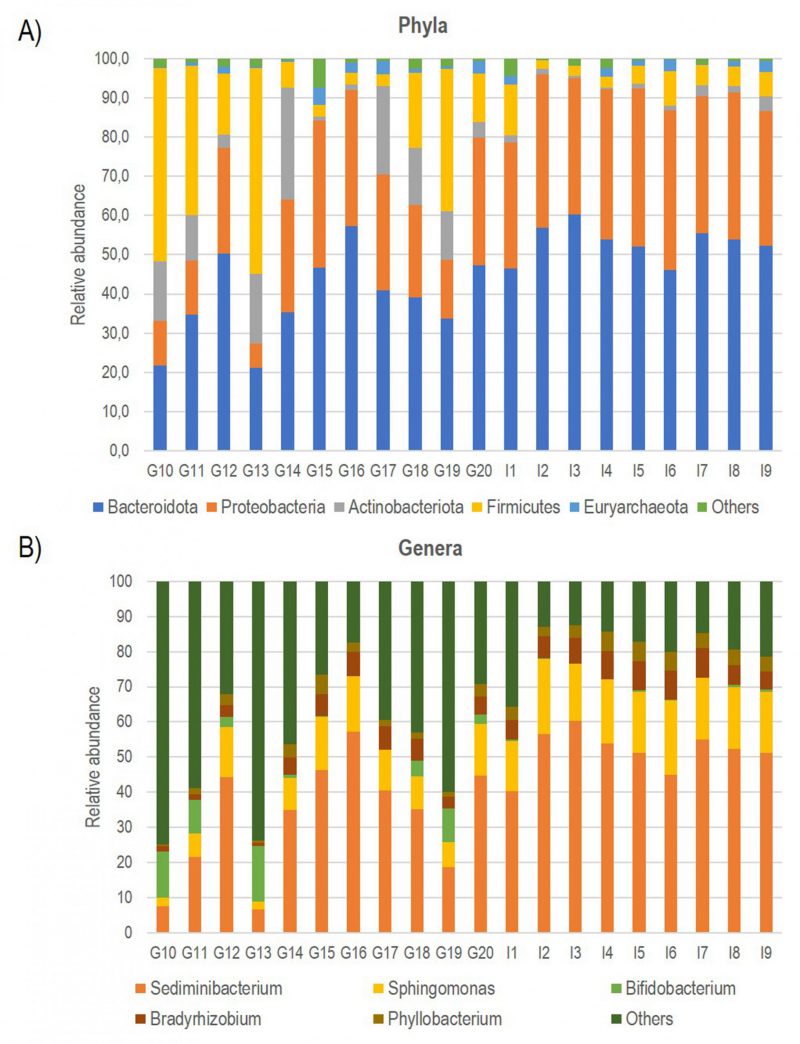
FIGURE 1: Bar plot showing the relative abundance of the five most represented Phyla (A) and Genera (B) documented in all CAV samples.
By continuing to use the site, you agree to the use of cookies. more information
The cookie settings on this website are set to "allow cookies" to give you the best browsing experience possible. If you continue to use this website without changing your cookie settings or you click "Accept" below then you are consenting to this. Please refer to our "privacy statement" and our "terms of use" for further information.