
Back to article: The first taxonomic and functional characterization of human CAVD-associated microbiota
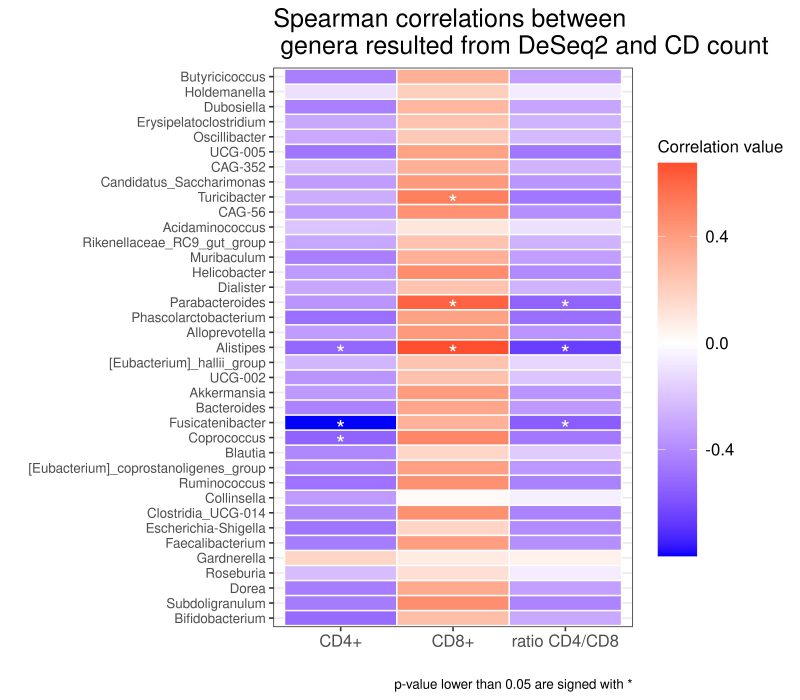
FIGURE 4: Heatmap of Spearman correlation between the differential abundant genera and Tcc expressions (CD4+, CD8+, ratio CD4/CD8). Colours indicate the rho of Spearman's coefficient and the asterisk (*) denotes a correlation with p value lower than 0.05. Red shades indicate positive correlations, whereas blue shades indicate negative correlations. (Tcc= T cell clones).