Back to article: Extracellular DNA secreted in yeast cultures is metabolism-specific and inhibits cell proliferation
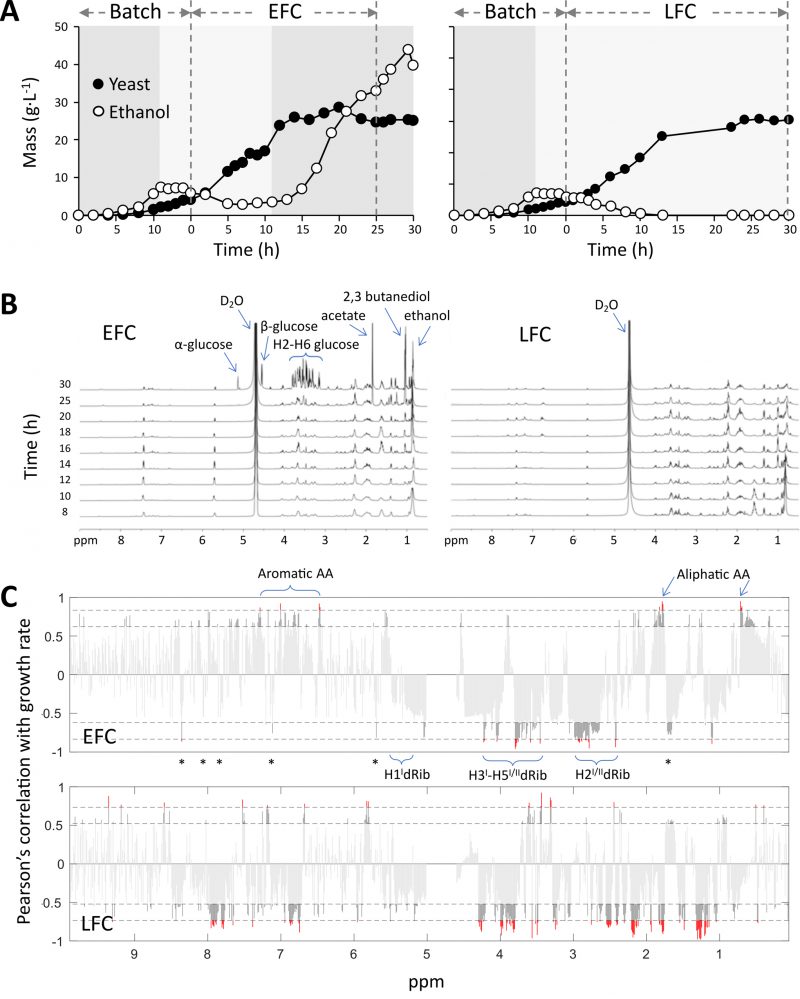
FIGURE 1: Fed-batch cultures of S. cerevisiae CEN.PK2-1C carried out with either exponential (EFC) or limited (LFC) nutrient feeding and associated 1H NMR metabolomic profiles. (A) Dynamic trends of yeast biomass and ethanol in the medium. Dashed vertical lines separate the batch and the feeding phases. Dark and light grey areas indicate the occurrence of either fermentative or respiratory metabolism, respectively. (B) 1H NMR metabolomic fingerprinting profiles of growth media, collected at different times between 8 and 30 h of the feeding phases. (C) Pearson's correlation of 1H NMR integrated signals of the growth media and yeast growth rates, along 30 h of the feeding phases, in conditions of either unlimited or limited nutrient availability, EFC and LFC, respectively. Labels indicate 1H NMR signals associated to nutrients and DNA constituents. Asterisks refer to signals diagnostic for nitrogen bases (see text for details). Red and dark grey respectively correspond to significance levels at p< 0.001 and p< 0.05. In EFC the significant negative correlations correspond to signals associated to DNA, whereas the positive correlations refer to signals associated to different nutrients. Instead, in LFC, many negative correlations still include the same DNA related signals, but also those signals linked to the limited nutrients.

