Back to article: Extracellular DNA secreted in yeast cultures is metabolism-specific and inhibits cell proliferation
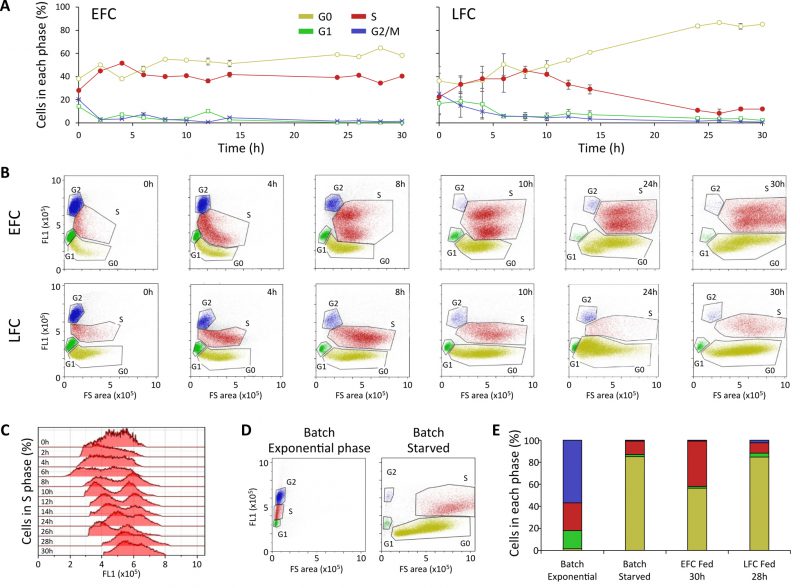
FIGURE 5: Flow cytometric analysis (FCM) of the cell cycle shows an arrest in S phase despite unlimiting nutrient availability. (A) Dynamic trends of the yeast population in the different cell cycle phases (G1, G0, S, G2/M) during the feeding phase of either unlimiting (EFC) or limiting (LFC) nutrient availability. (B) Representative outputs of the bi-dimensional FCM analyses at different times of the feeding phase of EFC and LFC. In the dot plots of each panel, G0, G1, S, and G2/M cell cycle stages are identified according to both forward scatter signal (FSC-A) and green fluorescence (FL1-A), representing cell size and DNA content per cell, respectively. (C) S phase heterogeneity in the yeast population during the EFC feeding phase. The histograms show the fluorescence (FL1-A) distribution during the S phase of the EFC. Starting from 8 h, a doubling of the population, in terms of fluorescence intensity, is evident, while at the end of the cultivation run a convergence towards only one fluorescence peak is observed. (D) Outputs of the bi-dimensional FCM analyses for a yeast population in a batch exponential and starved culture. (E) Comparison of the percentages of the yeast population in each phase of the cell cycle (G1, G0, S, G2/M) in different culture conditions: batch (exponential), batch (starved), EFC (30 h of feeding), LFC (30 h of feeding).

