
Back to article: D-Serine reduces the expression of the cytopathic genotoxin colibactin
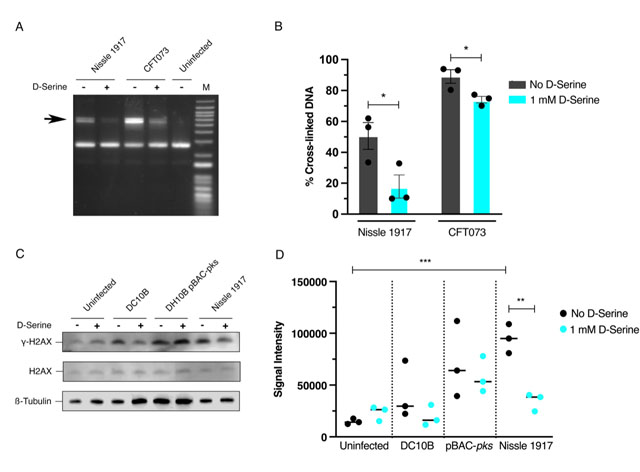
FIGURE 3: Repression of colibactin by D-Serine reduces cross-link formation, and DNA damage in Hela cell infection. (A and B) Nissle 1917 and CFT073 were cultured for 5 h in M9 minimal media alone (-) or in media supplemented with 1 mM D-Serine (+) before 1.5 × 10⁶ CFU was exposed to linearized plasmid DNA for 40 min. The DNA was extracted, and cross-linking activity was determined by electrophoresis in denaturing conditions. (A) DNA cross-link formation of linearized plasmid DNA exposed to Nissle 1917 and CFT073 was visualized after migration under alkaline denaturing conditions. M, DNA size marker (1 kB plus DNA ladder, Invitrogen). (B) The percentage of the DNA signal in the upper, cross-linked band (indicated by the arrow in panel A) relative to the total DNA signal. Signal intensities were quantified using ImageJ for three independent experiments and statistical significance was assessed by unpaired Student's t-test with, * indicating P = < 0.01. (C and D) HeLa cells were infected for 4 h with live pks+ and pks– E. coli with a multiplicity of infection (MOI) of 400 bacteria per cell or left uninfected. Infections were performed in wells containing MEM-HEPES alone (-) or with media supplemented with 1 mM D-Serine (+). (C) Immunoblot analysis of cell lysates extracted 4 h post infection. Phosphorylated histone (γ-H2AX) was used as an indicator of double stranded DNA breaks and total histone (H2AX) was used as an internal control. β-Tubulin was used as a loading control for cell lysates. DH10B pBAC-pks and DC10B were used as positive and negative controls, respectively. (D) Signal intensities of bands were measured using LI-COR Image Studio software. γ-H2AX signals were corrected to account for any variation in loading using β-Tubulin signal intensity. Experimental signal was normalized so that the mean signal intensity of the eight samples was equivalent for each experiment. The experiment was carried out in triplicate. Columns represent mean +/- SEM with individual experimental observations indicated by data points. Statistical significance was assessed by unpaired Student's t-test with, ** and *** indicating P < 0.01 and 0.001, respectively.